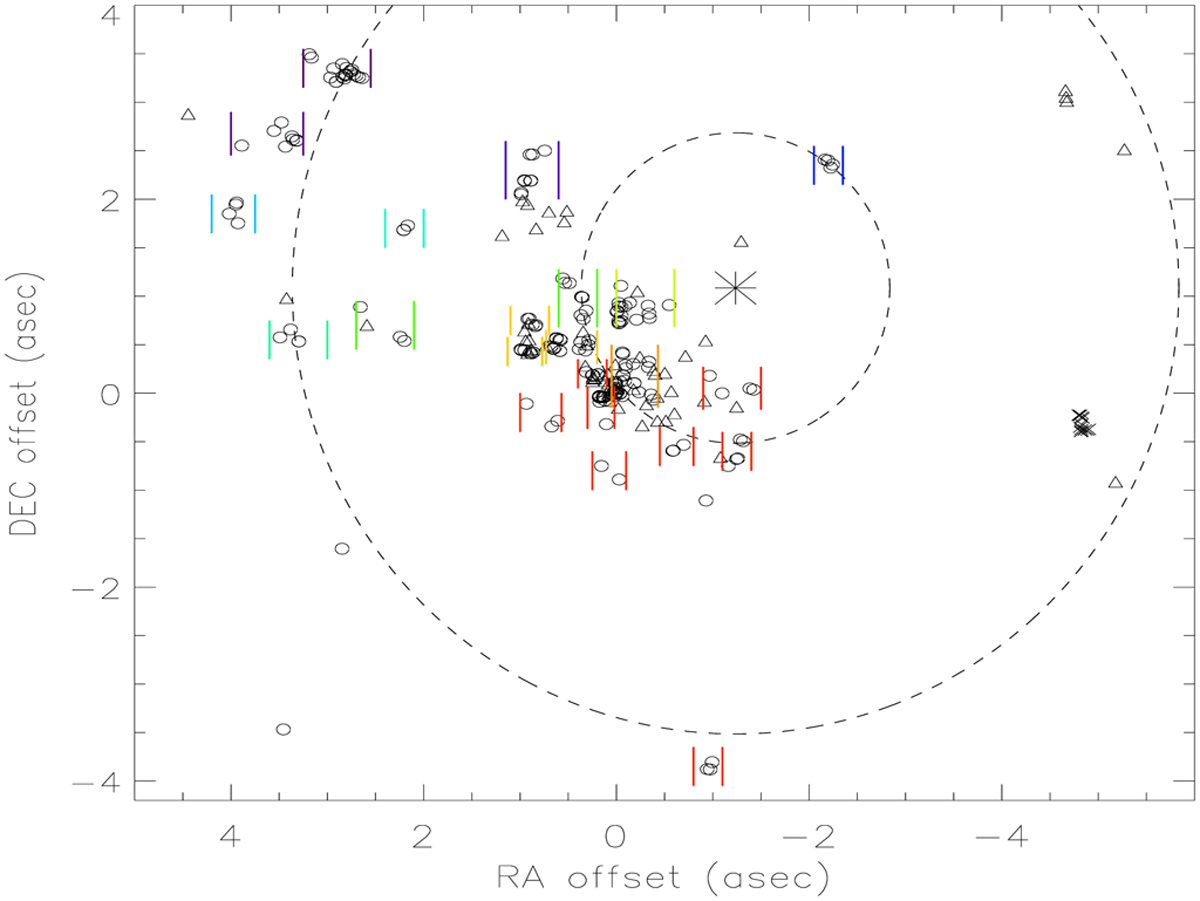
Fig. 5
Download original image
Locations of the OH maser spots, observed with the VLBA, are indicated with small circles. These spots are the same as those plotted in Fig. 1 (also with circles). The asterisk represents the (α, δ)m point. The groups used to estimate the average velocity (Fig. 8) are indicated with vertical bars. The Argon et al. (2000) OH maser spots are indicated with triangles and the methanol maser cloudlets with crosses (×). All the methanol maser cloudlets that lie in this FOV (Bartkiewicz et al. 2014; Pandian et al. 2011) are on the west side, clumped together near the large dashed circle.
Current usage metrics show cumulative count of Article Views (full-text article views including HTML views, PDF and ePub downloads, according to the available data) and Abstracts Views on Vision4Press platform.
Data correspond to usage on the plateform after 2015. The current usage metrics is available 48-96 hours after online publication and is updated daily on week days.
Initial download of the metrics may take a while.