Open Access
Fig. 3
Download original image
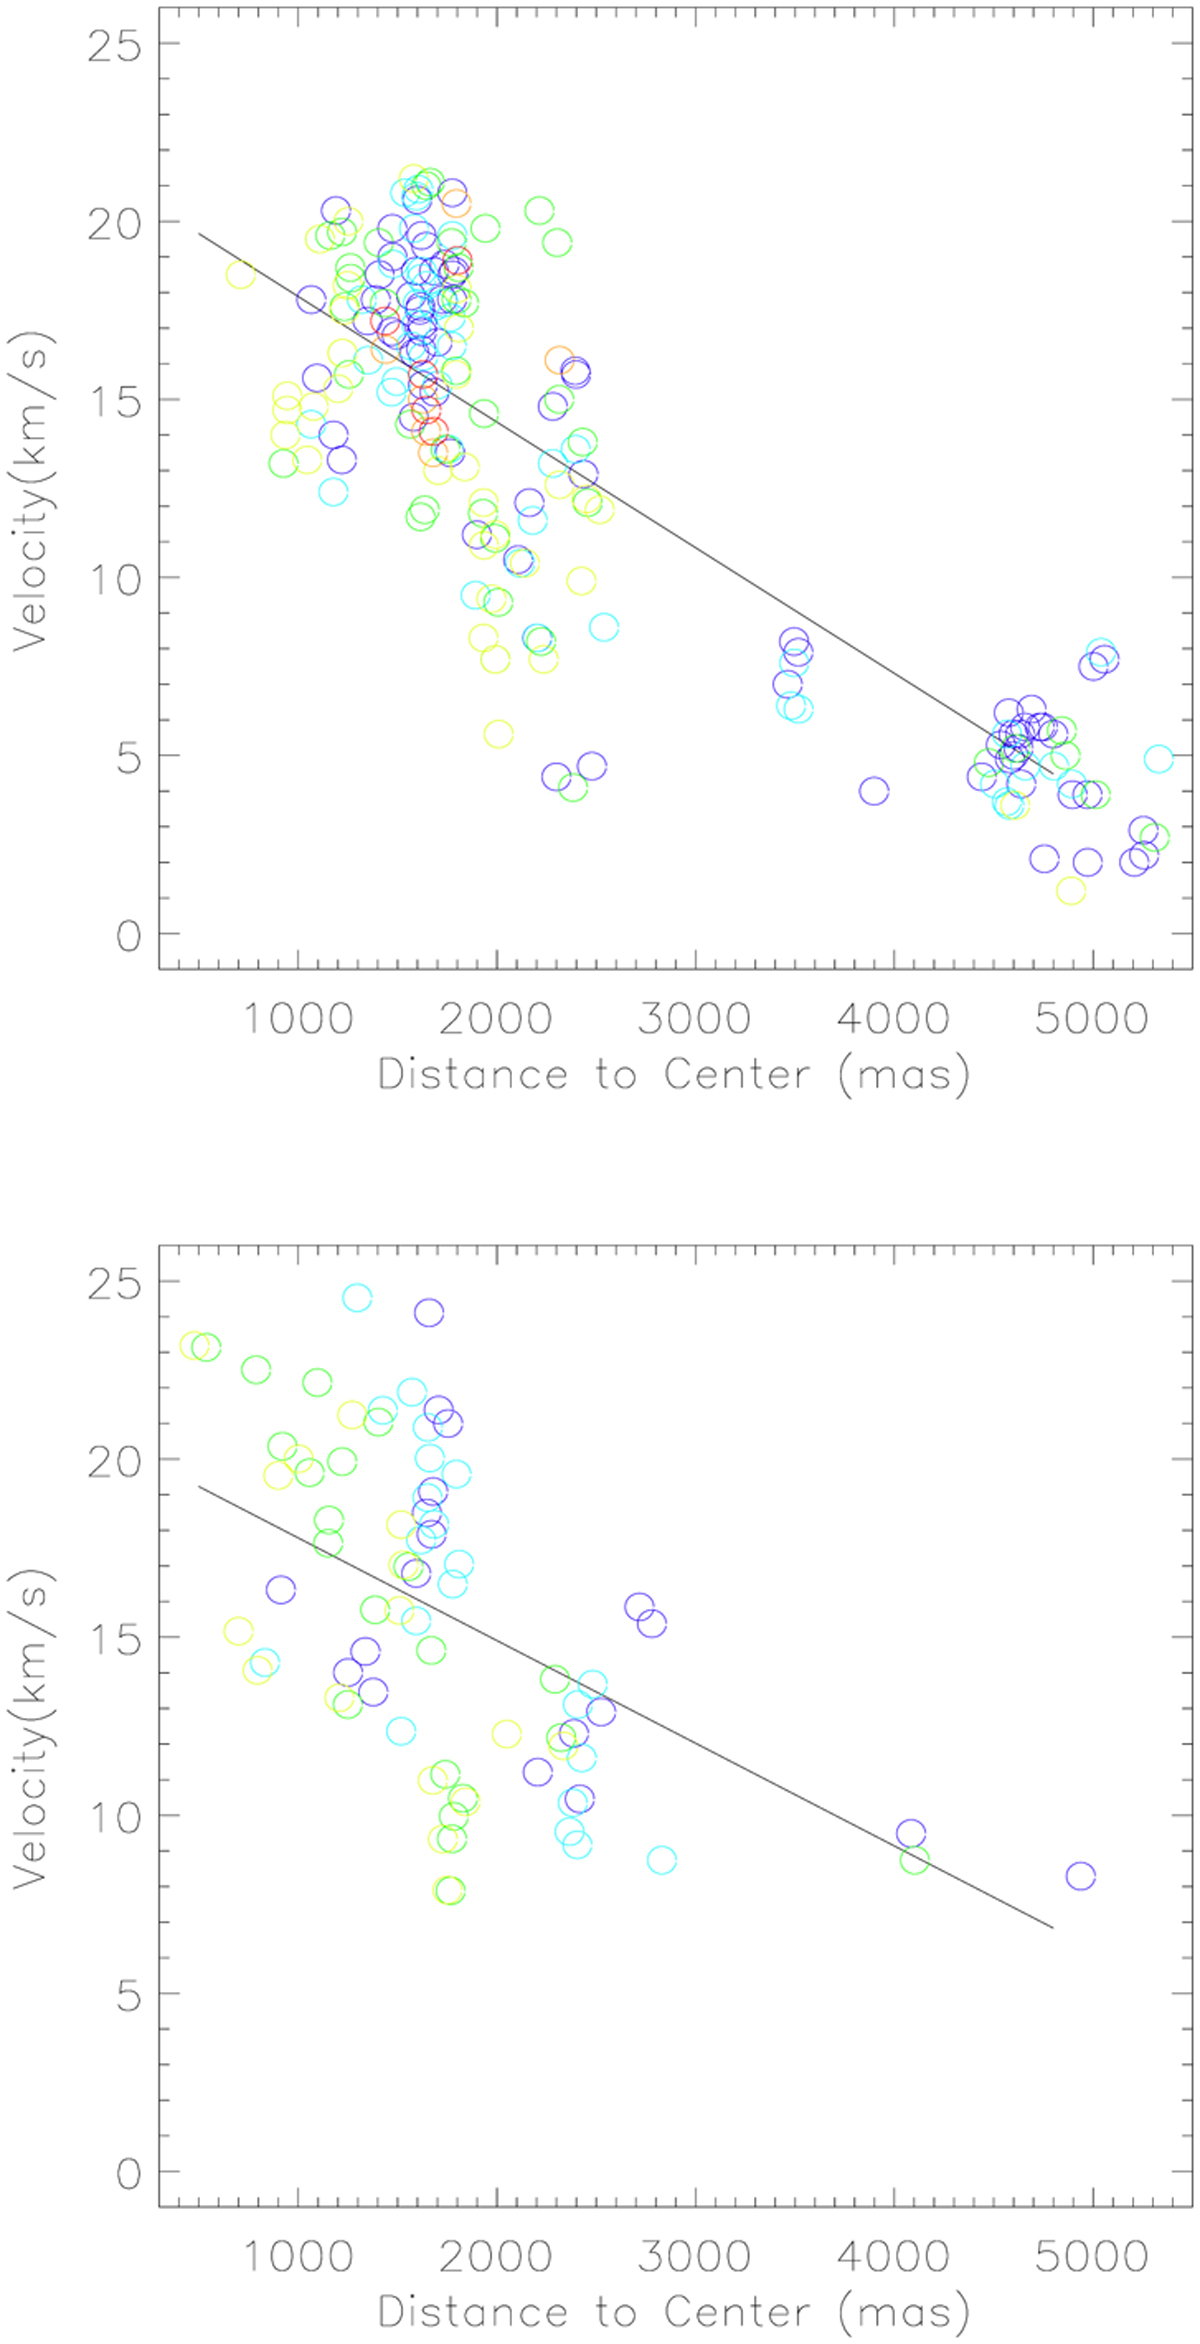
Vobs−Vsys (with Vsys = 8.0 km s−1) versus the distance to the (α, δ)m point for the OH VLBA data shown (top). A clear trend is seen, where the velocity grows as the distance d(α,δ)m decreases. Same relation but for the VLA data of colour (bottom) taken from Argon et al. (2000). Symbols and colours are the same as in Fig. 1.
Current usage metrics show cumulative count of Article Views (full-text article views including HTML views, PDF and ePub downloads, according to the available data) and Abstracts Views on Vision4Press platform.
Data correspond to usage on the plateform after 2015. The current usage metrics is available 48-96 hours after online publication and is updated daily on week days.
Initial download of the metrics may take a while.