Fig. 1
Download original image
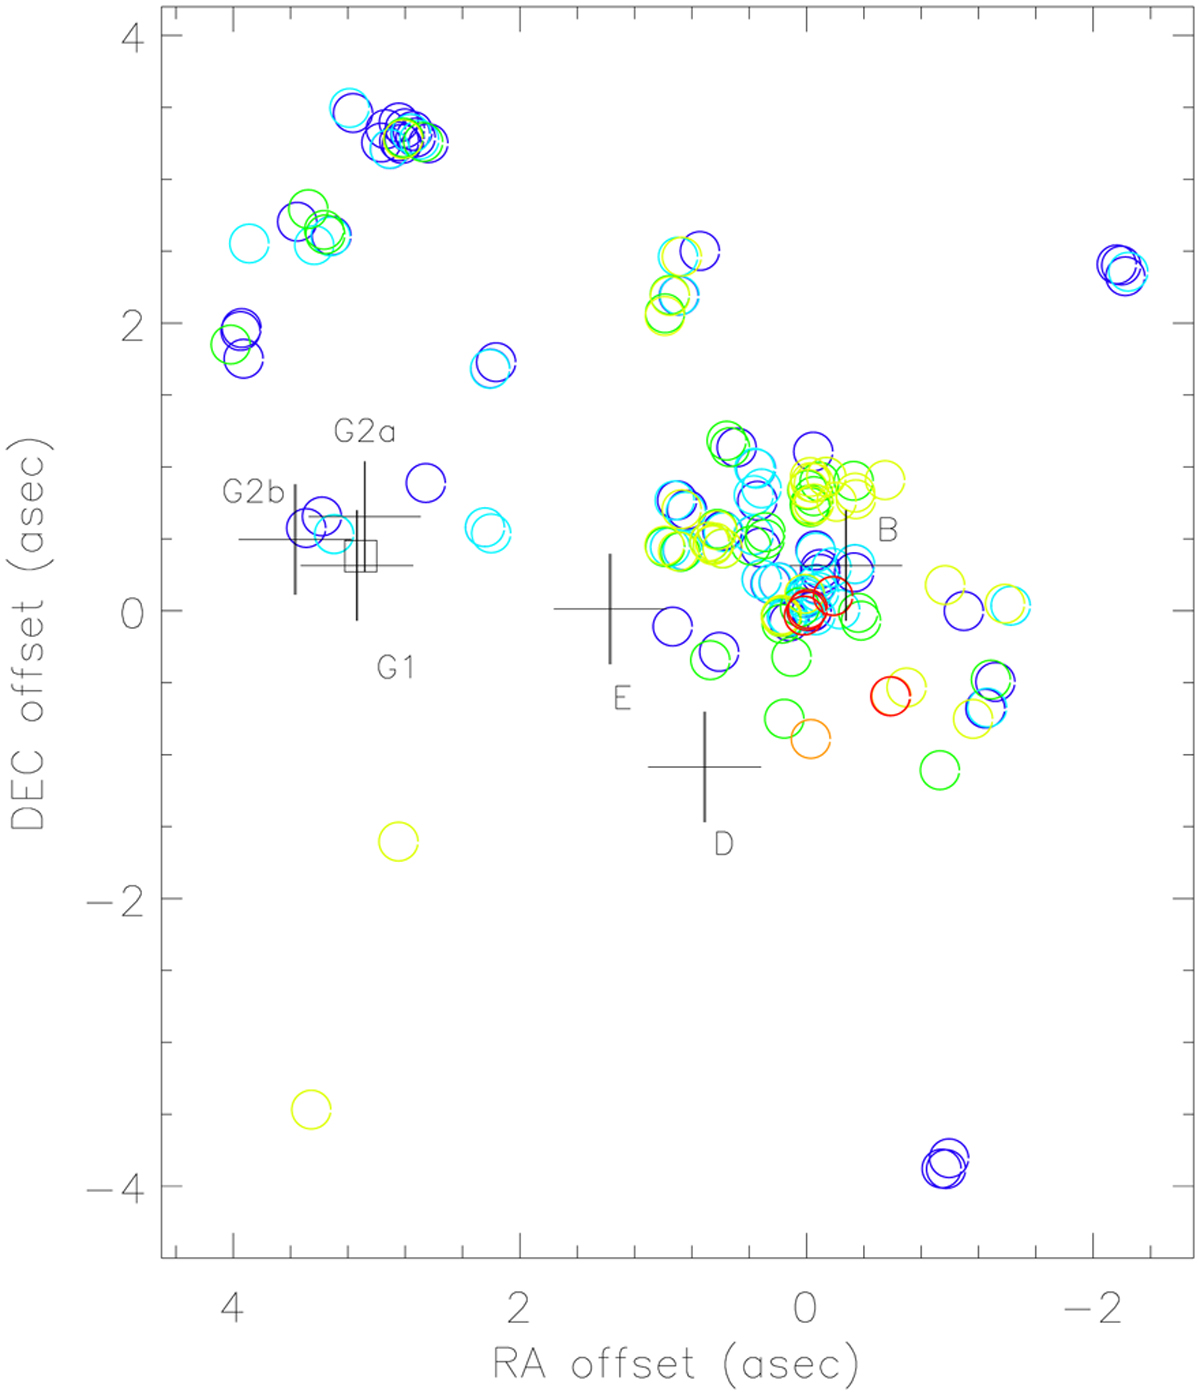
Map of the OH maser spots respect the reference coordinates. The (0,0) location corresponds to α = 19:10:13.2091, δ = 09:06:12.485 (J2000). Respectively, the dark and light blue circles represent the 1667 MHz LCP and RCP maser spots; green and yellow is for 1665 MHz LCP and RCP; and orange and red circles for 1612 MHz LCP and RCP. The crosses indicate the locations of HII regions, reported by De Pree etal. (1997), with the corresponding letters used to refer to each of them. The square that overplots to the cross, which represents G1, corresponds to the location of the centre of the bipolar outflow of Gwinn et al. (1992).
Current usage metrics show cumulative count of Article Views (full-text article views including HTML views, PDF and ePub downloads, according to the available data) and Abstracts Views on Vision4Press platform.
Data correspond to usage on the plateform after 2015. The current usage metrics is available 48-96 hours after online publication and is updated daily on week days.
Initial download of the metrics may take a while.