Fig. 4.
Download original image
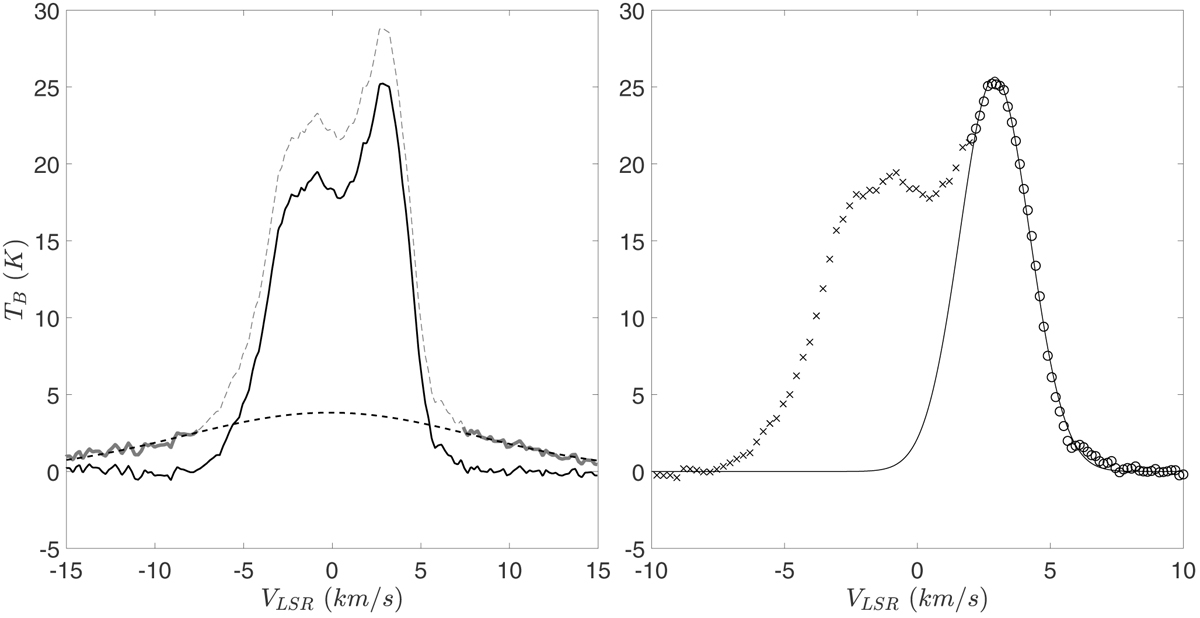
Left panel: subtraction of extremely diffuse gas from H I sample profile. Bold gray lines are wings fitted by a single Gaussian (black dashed line) and the gray dashed line is the section we excluded from the fit; the solid black line is the result of the subtraction, where the diffuse component is severely reduced. Right panel: narrow component extraction: crosses indicate points below 2 km s−1 which we suppose are not directly linked with gas traced by 12CO and which were excluded for the narrow Gaussian fit (black solid line). Circles denote points we used for the fit.
Current usage metrics show cumulative count of Article Views (full-text article views including HTML views, PDF and ePub downloads, according to the available data) and Abstracts Views on Vision4Press platform.
Data correspond to usage on the plateform after 2015. The current usage metrics is available 48-96 hours after online publication and is updated daily on week days.
Initial download of the metrics may take a while.