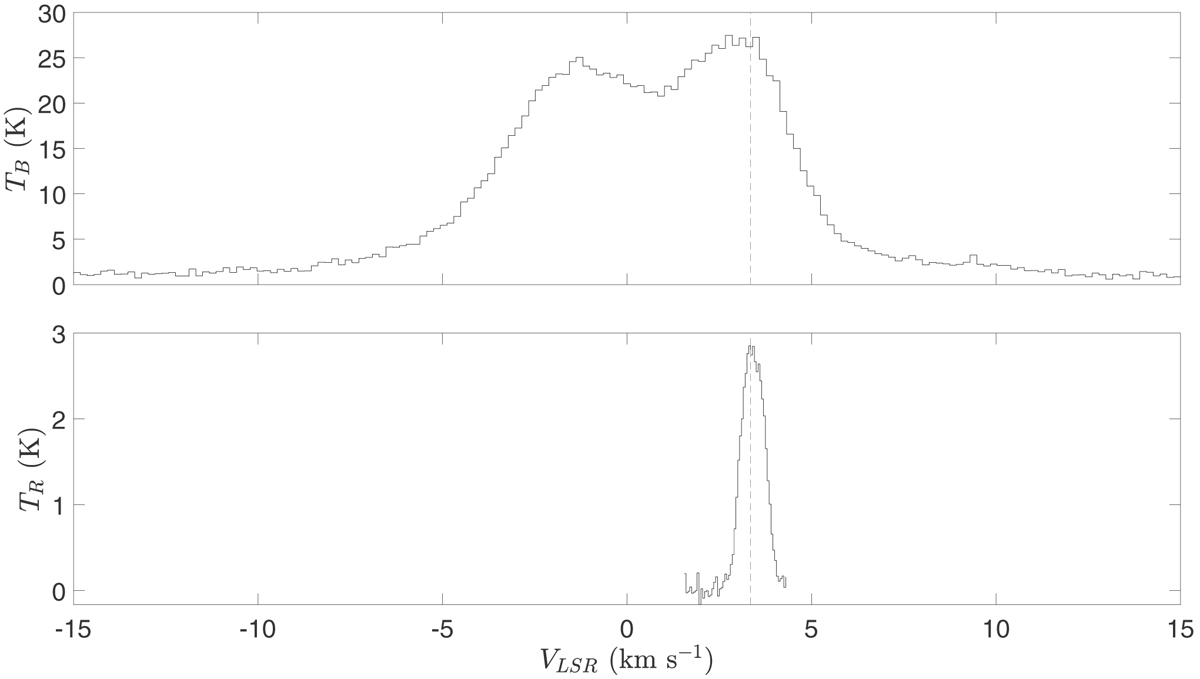
Fig. 1.

Download original image
Sample spectra of MBM 40 used in this study. Top panel: single GALFA spectrum at α = 242.7583° ,δ = +21.8084° (J2000.0), in the lower part of the western ridge of MBM 40. Bottom panel: sample FCRAO 12CO spectrum near the same position as the H I, obtained by averaging 64 spectra in an 8 × 8 pattern to enhance the S/N. The vertical dashed line shared by two plots indicates the bulk velocity of the cloud (3.35 km s−1). The H I spectrum shows the brightness temperature (TB), and the 12CO spectrum is in terms of the radiation temperature (TR).
Current usage metrics show cumulative count of Article Views (full-text article views including HTML views, PDF and ePub downloads, according to the available data) and Abstracts Views on Vision4Press platform.
Data correspond to usage on the plateform after 2015. The current usage metrics is available 48-96 hours after online publication and is updated daily on week days.
Initial download of the metrics may take a while.


