Open Access
Fig. 1.
Download original image
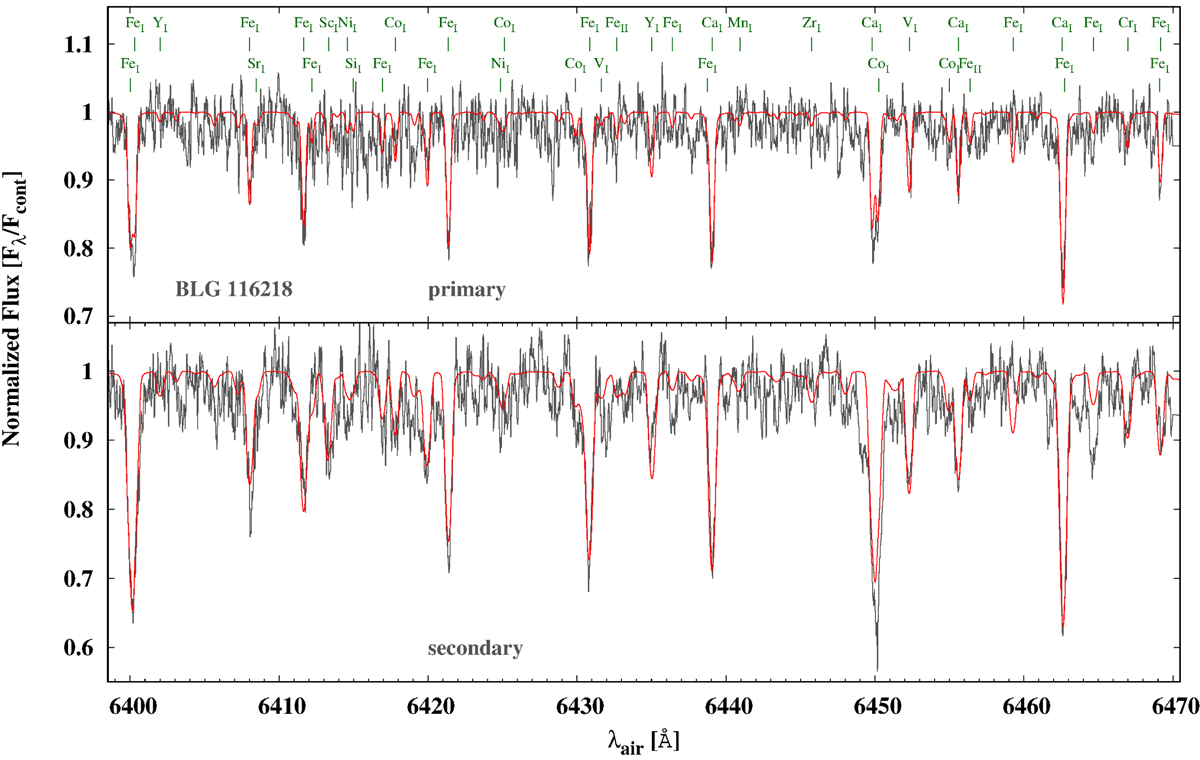
6399–6400 Å region of disentangled spectra (grey) of the primary (top) and the secondary (bottom) components of BLG-116218 compared to the best-fit synthetic spectra (red). Selected identified spectral features are shown at the top.
Current usage metrics show cumulative count of Article Views (full-text article views including HTML views, PDF and ePub downloads, according to the available data) and Abstracts Views on Vision4Press platform.
Data correspond to usage on the plateform after 2015. The current usage metrics is available 48-96 hours after online publication and is updated daily on week days.
Initial download of the metrics may take a while.