Fig. 8.
Download original image
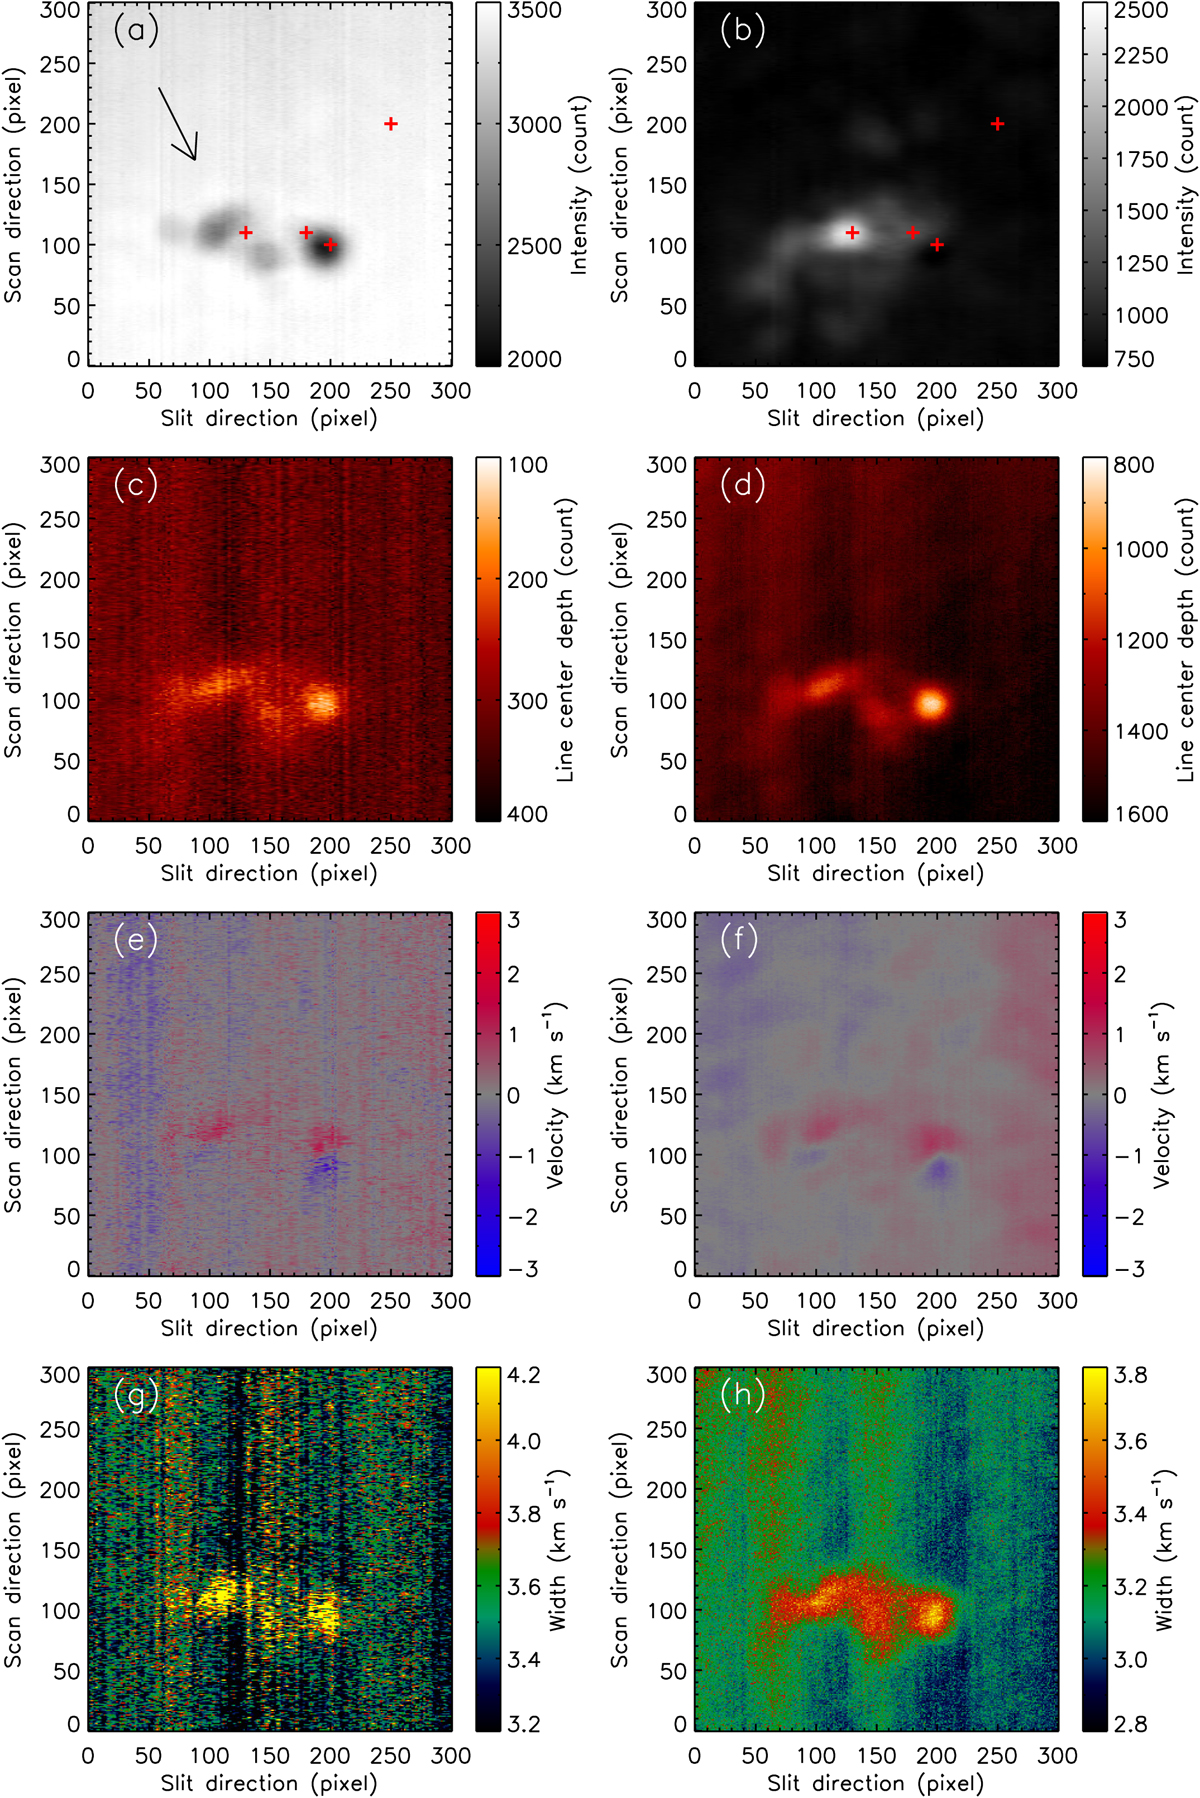
Reconstructed maps from the spectra and fitting parameters. (a)–(b) Intensity maps of the Si I and Hα line center. The arrow points to disk center. The red plus symbols denote positions whose line profiles are shown in Fig. 9. (c)–(d) Line-center depth maps of the Si I and Fe I line. (e)–(f) Doppler maps of the Si I and Fe I line. (g)–(h) Line-width maps of the Si I and Fe I line.
Current usage metrics show cumulative count of Article Views (full-text article views including HTML views, PDF and ePub downloads, according to the available data) and Abstracts Views on Vision4Press platform.
Data correspond to usage on the plateform after 2015. The current usage metrics is available 48-96 hours after online publication and is updated daily on week days.
Initial download of the metrics may take a while.