Open Access
Fig. 2.
Download original image
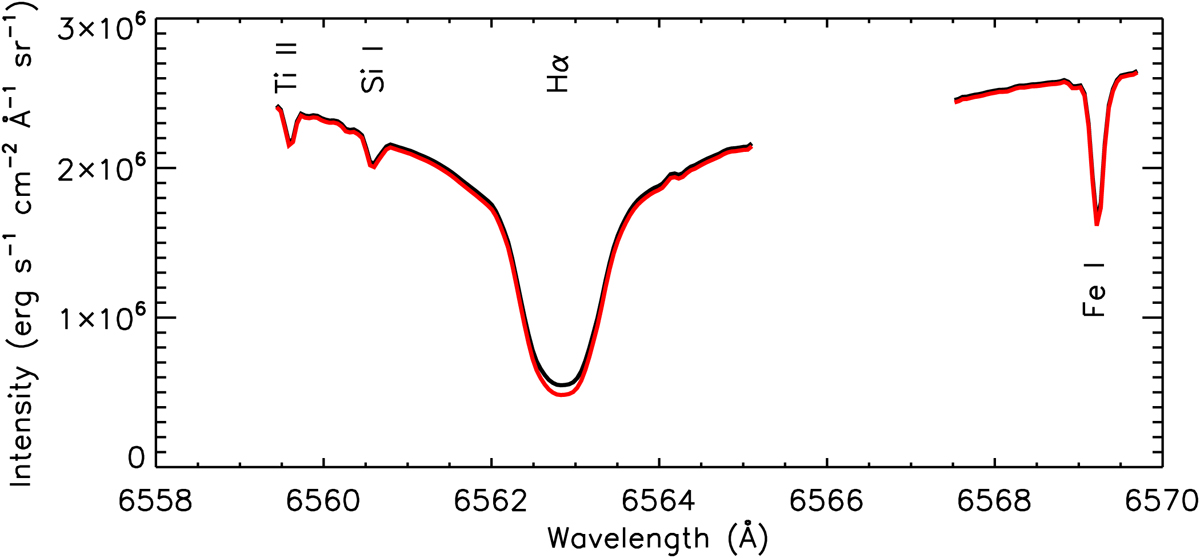
Sample disk-center spectra with identified lines from the CHASE Hα and Fe I wavebands after radiometric calibration. The black curve is the original spectra, and the red one is after stray-light correction.
Current usage metrics show cumulative count of Article Views (full-text article views including HTML views, PDF and ePub downloads, according to the available data) and Abstracts Views on Vision4Press platform.
Data correspond to usage on the plateform after 2015. The current usage metrics is available 48-96 hours after online publication and is updated daily on week days.
Initial download of the metrics may take a while.