Fig. 2
Download original image
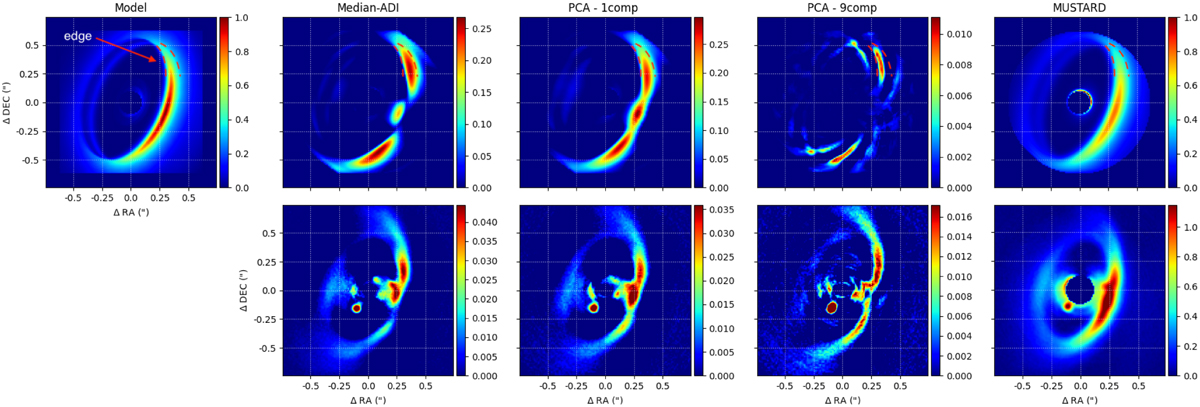
Comparison of different post-processing methods applied to fiducial and observed ADI sequences of PDS 70. Top: final image obtained after post-processing an ADI sequence containing only a disk model (left) with different methods: median-ADI, PCA-ADI considering one and nine principal components, and mustard (from left to right). Bottom: application of the same post-processing methods to the ADI data set from March 2019 obtained in the K1 filter (program 1100.C-0481(L)). The axis grids of both model reductions and observation are scaled identically. The color axis represents the raw flux restored from reductions.
Current usage metrics show cumulative count of Article Views (full-text article views including HTML views, PDF and ePub downloads, according to the available data) and Abstracts Views on Vision4Press platform.
Data correspond to usage on the plateform after 2015. The current usage metrics is available 48-96 hours after online publication and is updated daily on week days.
Initial download of the metrics may take a while.