Fig. 9.
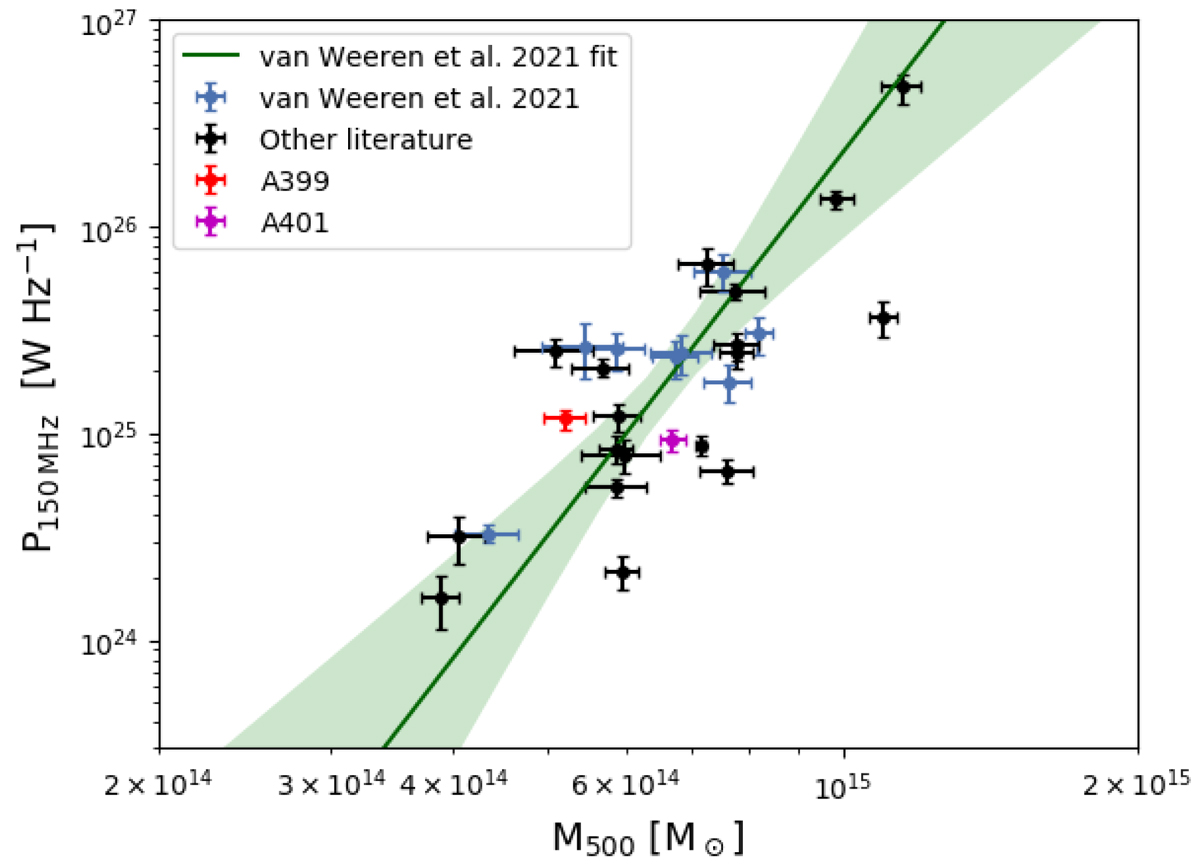
Download original image
Mass and radio power relation. The fitted regression line with a 3σ confidence interval in the shaded area and the data points in cyan come from the sample in van Weeren et al. (2021). The literature data points in black are taken, similar to van Weeren et al. (2021), from previous LOFAR and GMRT studies, and a correlation line is fit using the bivariate correlated errors and intrinsic scatter (BCES) orthogonal regression algorithm (Akritas & Bershady 1996). We left out the radio halo candidates. The radio halos A399 and A401 are added. Error bars include statistical and systematic uncertainties.
Current usage metrics show cumulative count of Article Views (full-text article views including HTML views, PDF and ePub downloads, according to the available data) and Abstracts Views on Vision4Press platform.
Data correspond to usage on the plateform after 2015. The current usage metrics is available 48-96 hours after online publication and is updated daily on week days.
Initial download of the metrics may take a while.