Fig. 7.
Download original image
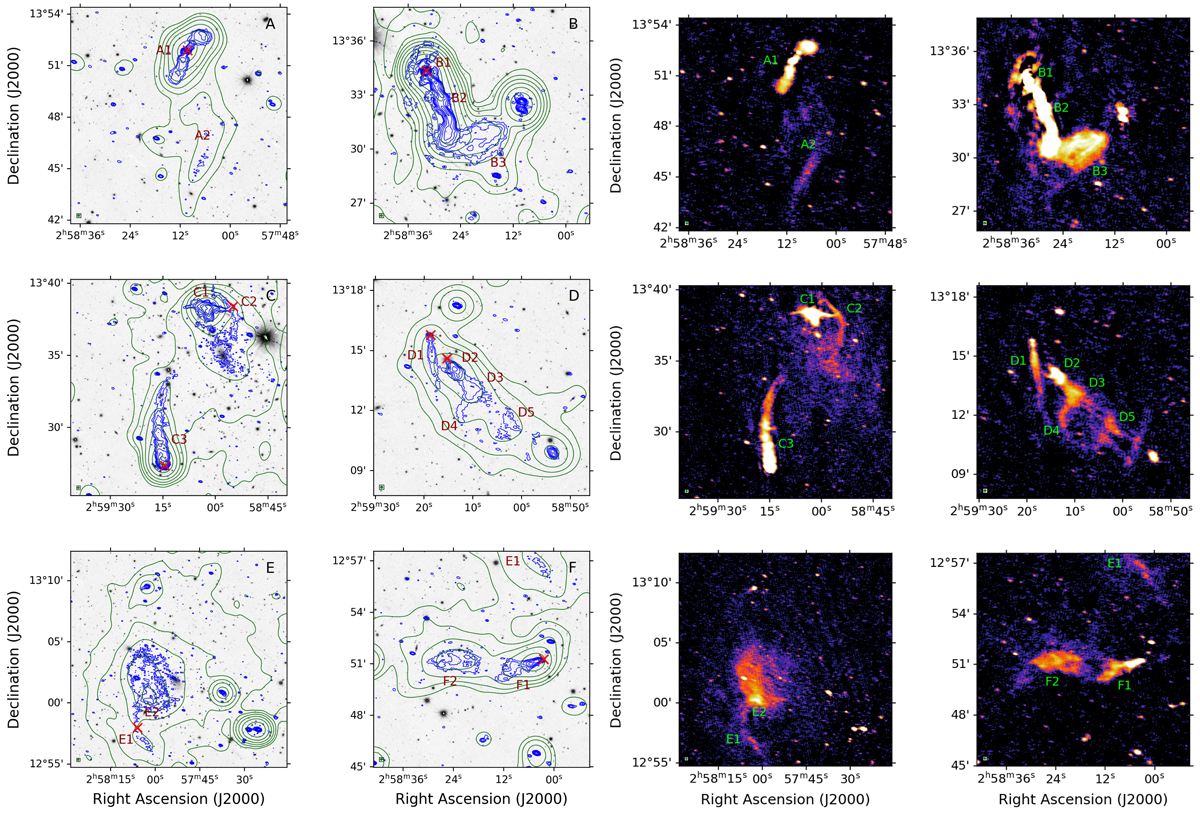
Zoomed images of the regions in Fig. 4. These are the same sources as in Fig. S4 from Govoni et al. (2019) and ordered in the same way to facilitate comparison. Left two panels: blue contours at a resolution of 5.9″ × 10.5″ and with σ = 79 μJy beam−1, and green contours at a resolution of 72.8″ × 75.9″ and σ = 809 μJy beam−1, both at 144 MHz. Red crosses are elliptical host galaxies from the radio sources, and we label the radio components discussed in the text in brown. The background grayscale images are optical sources from Pan-STARRS DR1 (Chambers et al. 2016). Right two panels: same regions as in the left panel at 5.9″ × 10.5″ with a surface brightness color plot. The square-root color scale of the images extends 1σ to 25σ to better highlight the plasma, and the labels are the same as in the left panel in green.
Current usage metrics show cumulative count of Article Views (full-text article views including HTML views, PDF and ePub downloads, according to the available data) and Abstracts Views on Vision4Press platform.
Data correspond to usage on the plateform after 2015. The current usage metrics is available 48-96 hours after online publication and is updated daily on week days.
Initial download of the metrics may take a while.