Fig. B.1.
Download original image
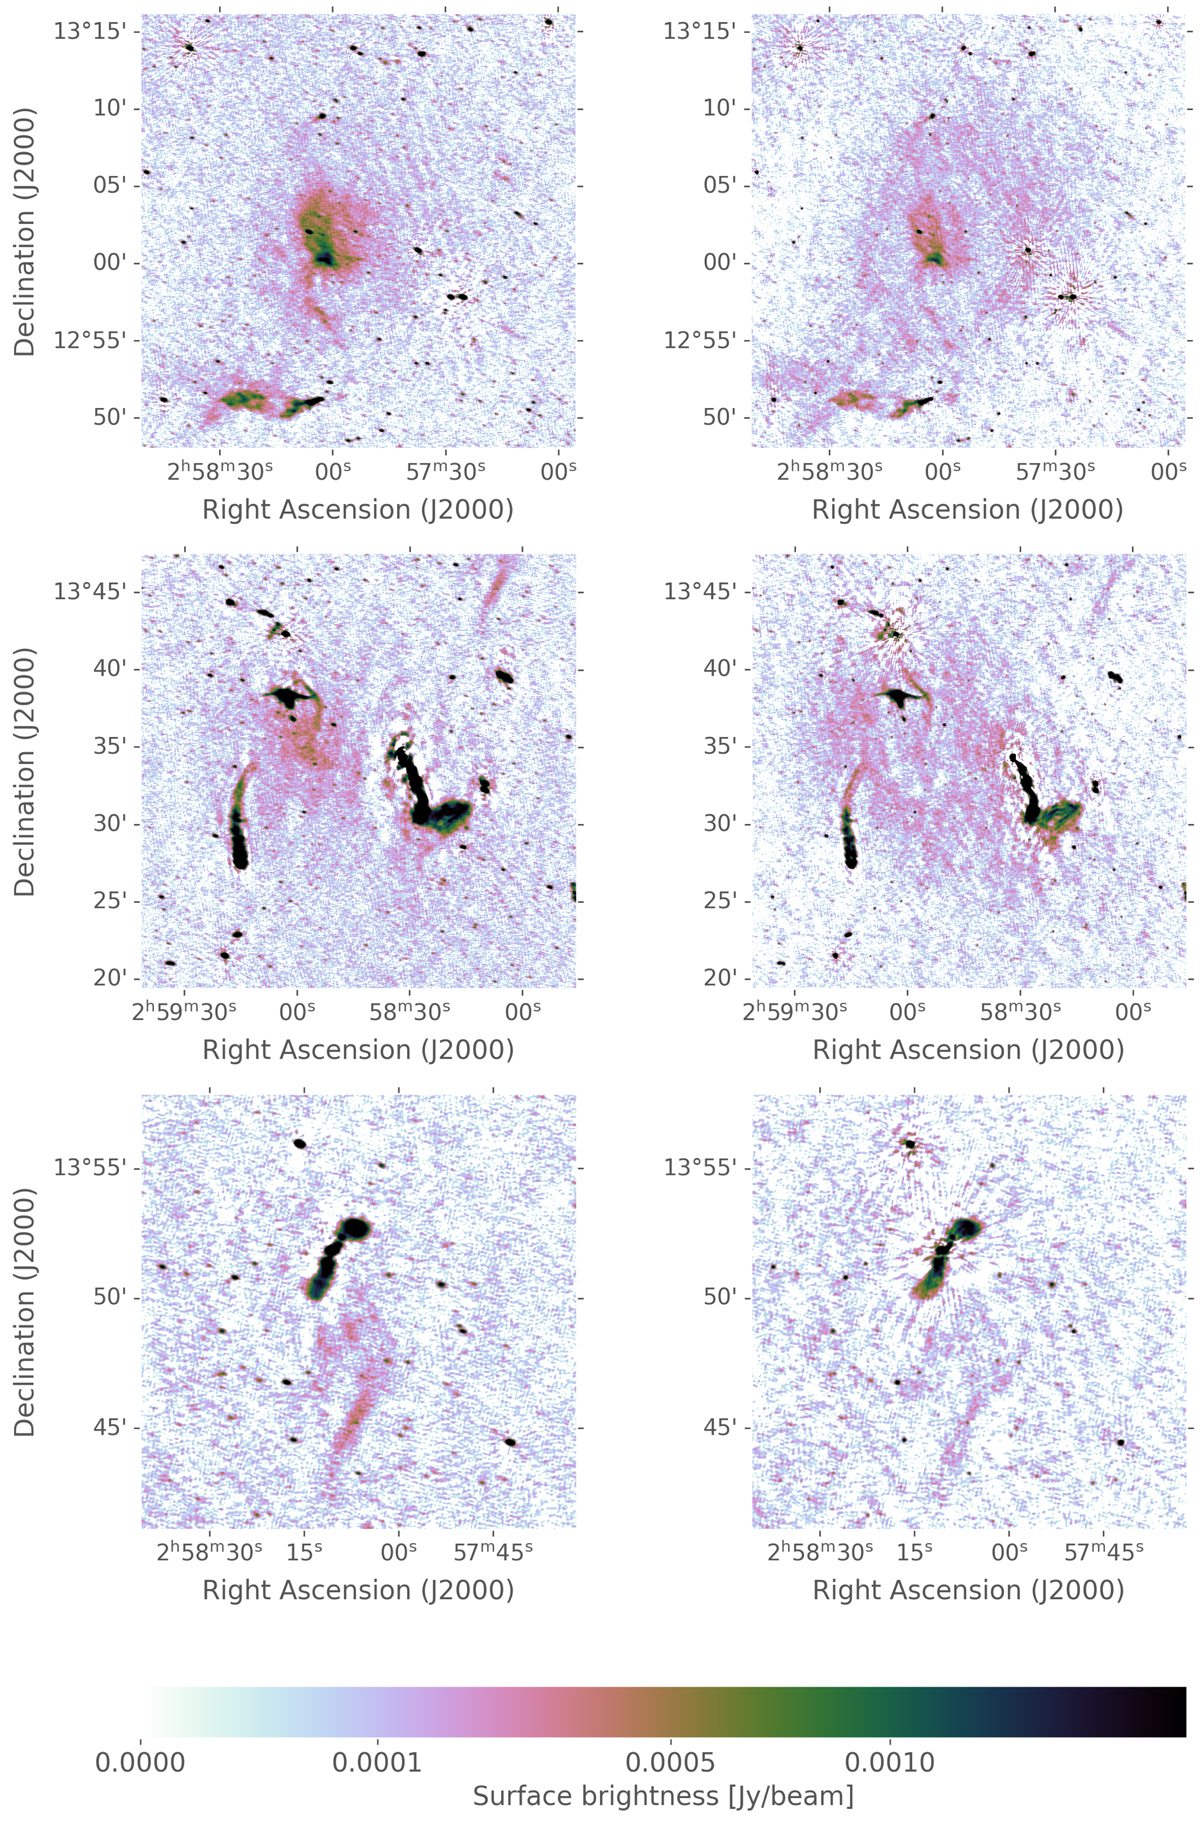
Image comparison between recalibration and the DDF-Pipeline. Left column: Images recalibrated with the method from this paper (see Section 2.2). Right column: Same images, produced with the DDF-Pipeline at the same color scale. The first row shows Abell 399, the second row shows Abell 401, and the last row shows the radio galaxy 2MASX J02581043+1351519 with its extended diffuse emission tail. The square-root scaled color bar extends from 0 to 25σ on average (average σ from both maps).
Current usage metrics show cumulative count of Article Views (full-text article views including HTML views, PDF and ePub downloads, according to the available data) and Abstracts Views on Vision4Press platform.
Data correspond to usage on the plateform after 2015. The current usage metrics is available 48-96 hours after online publication and is updated daily on week days.
Initial download of the metrics may take a while.