Fig. 10.
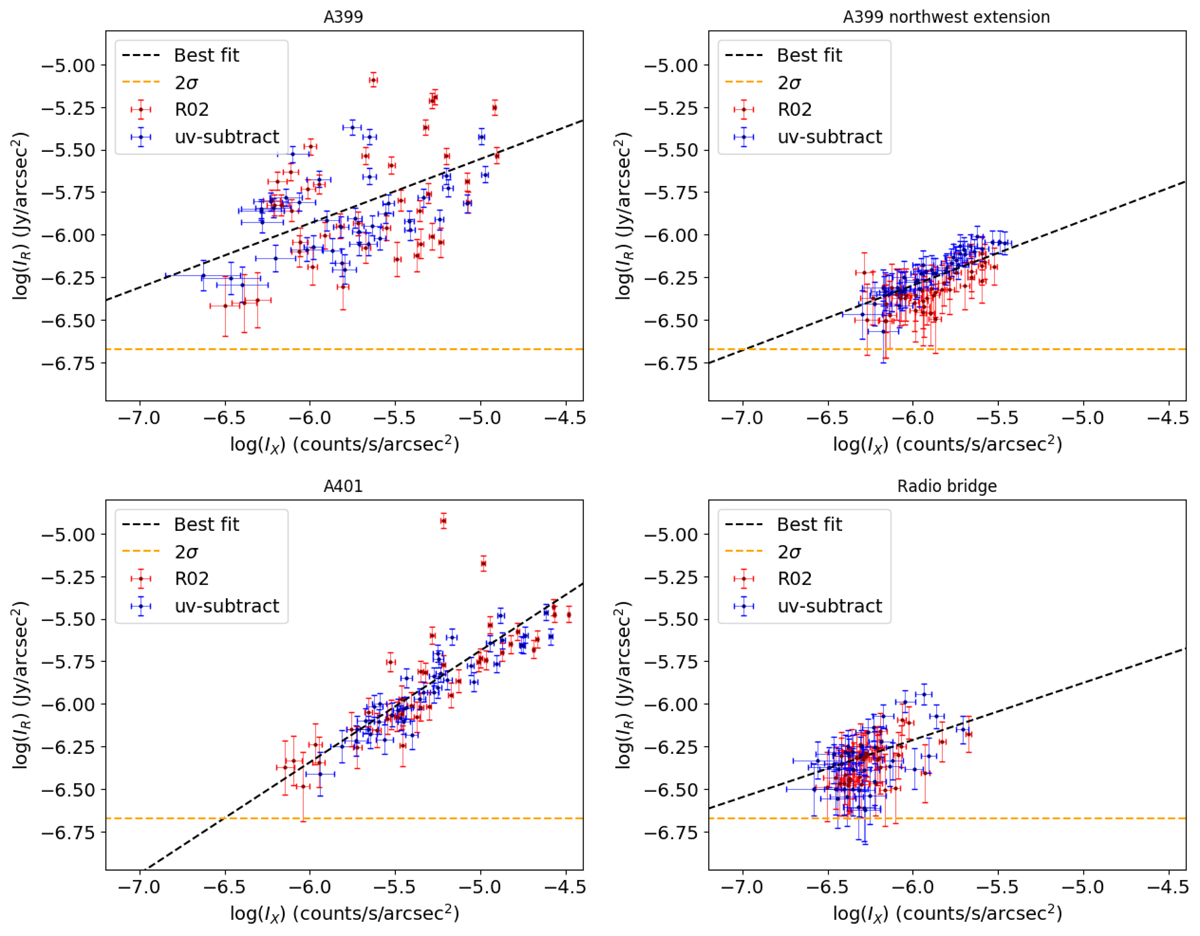
Download original image
Radio and X-ray surface brightness correlation plots for every cell from the grid used for the point-to-point analysis in the right panel of Fig. 6 for the R02 filter and uv-subtract maps. This is just one grid from the MC grid generation with 40 randomly drawn points to improve the readability of the plot. Top left panel: radio halo of A399. Top right panel: radio halo extension of A399. Lower left panel: radio halo of A401. Lower right panel: radio bridge. Error bars include the statistic and systematic uncertainties. The best linear fit with LIRA is given with a dashed black line. Only radio brightness values higher than 2σ are included.
Current usage metrics show cumulative count of Article Views (full-text article views including HTML views, PDF and ePub downloads, according to the available data) and Abstracts Views on Vision4Press platform.
Data correspond to usage on the plateform after 2015. The current usage metrics is available 48-96 hours after online publication and is updated daily on week days.
Initial download of the metrics may take a while.