Fig. 8
Download original image
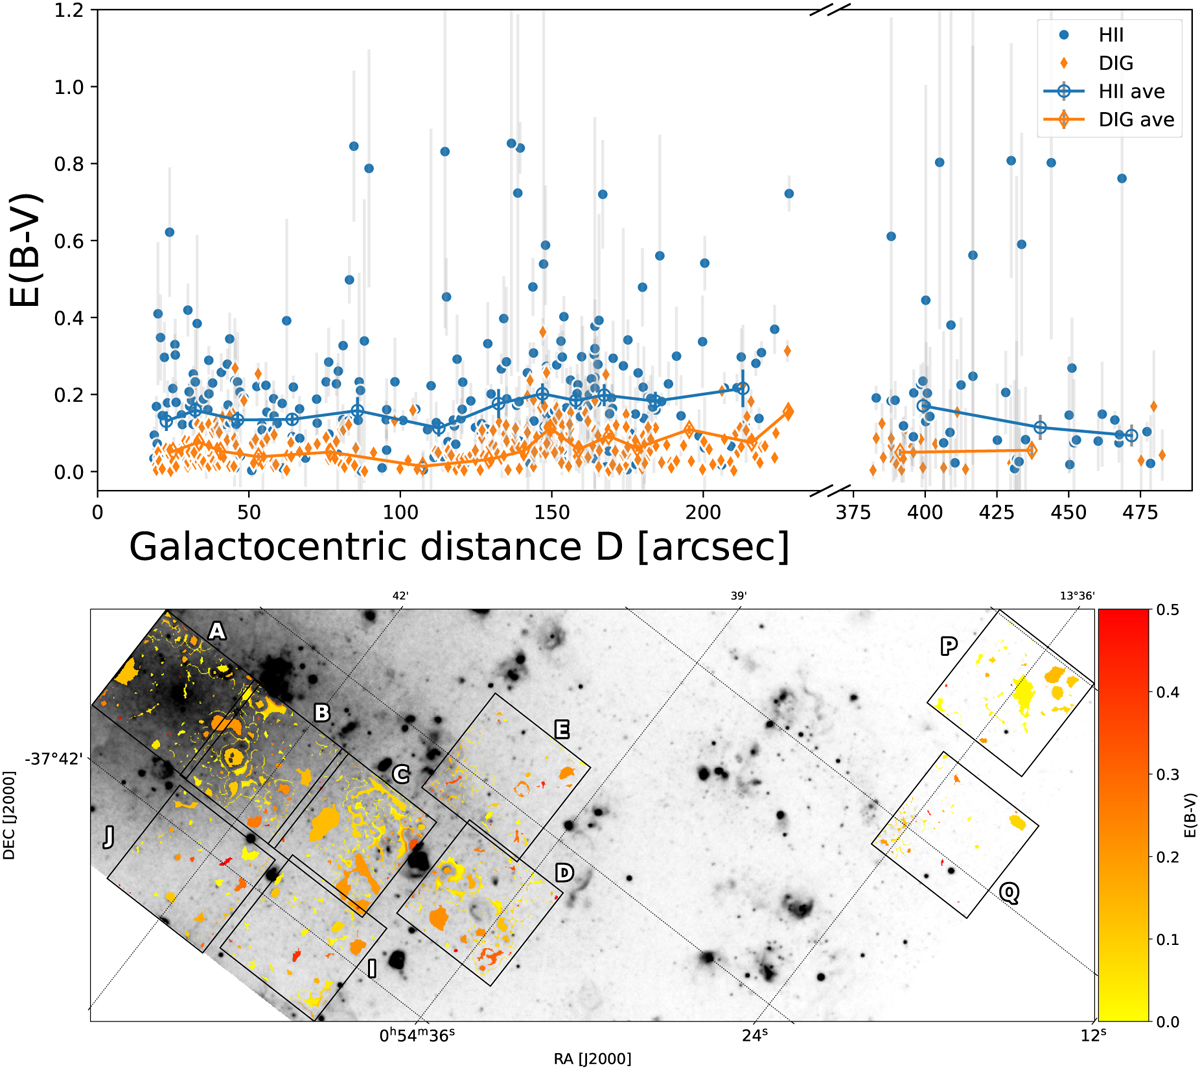
Sample nebular extinction. Top: E(B − V) as a function of galactocentric distance D for individual H II (black dots) and DIG regions (blue diamonds). Uncertainty-weighted averages in bins of 20 objects are also shown in red circles for H II and in orange diamonds for DIG. The propagated error bars are often smaller than the markers. The x-axis position of each uncertainty-weighted average is the average galactocentric distance for the dendrograms inside each bin. Bottom: 2D map of E(B − V).
Current usage metrics show cumulative count of Article Views (full-text article views including HTML views, PDF and ePub downloads, according to the available data) and Abstracts Views on Vision4Press platform.
Data correspond to usage on the plateform after 2015. The current usage metrics is available 48-96 hours after online publication and is updated daily on week days.
Initial download of the metrics may take a while.