Fig. 9
Download original image
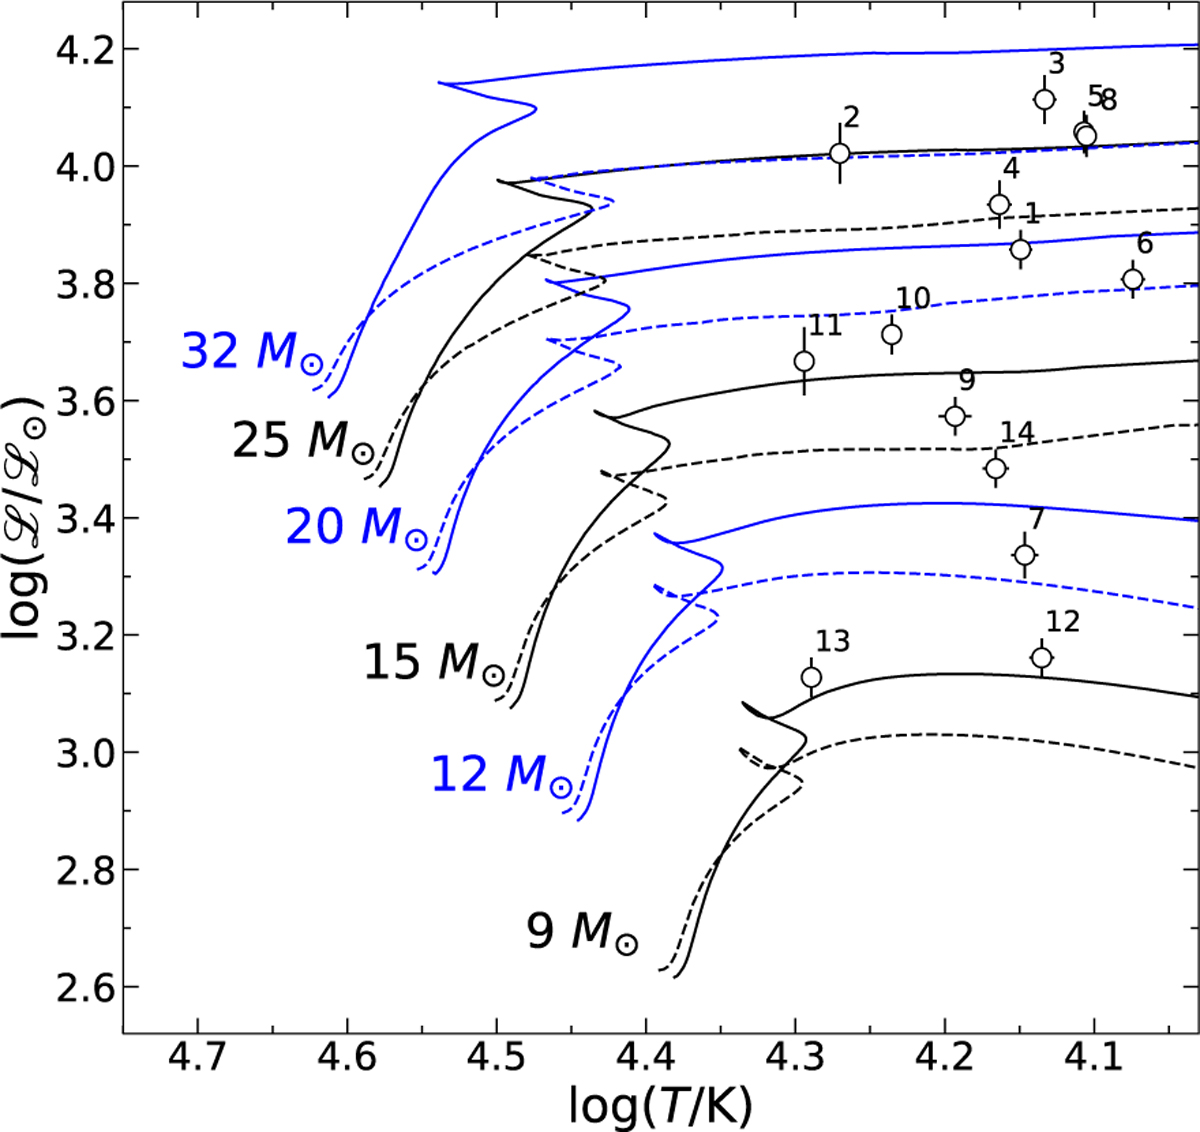
Sample objects located in the spectroscopic HRD, spectroscopic luminosity versus log-scale effective temperature, with 1σ error bars. Stellar evolution tracks (Ekström et al. 2012, for vrot = 0.4vcrit and Z = 0.014) ranging in ZAMS-masses from 9 to 32 M⊙ are indicated in alternating colours of blue and black. The dashed lines depict the corresponding tracks for non-rotating models. Numbers denote the internal sample star IDs.
Current usage metrics show cumulative count of Article Views (full-text article views including HTML views, PDF and ePub downloads, according to the available data) and Abstracts Views on Vision4Press platform.
Data correspond to usage on the plateform after 2015. The current usage metrics is available 48-96 hours after online publication and is updated daily on week days.
Initial download of the metrics may take a while.