Open Access
Fig. 7
Download original image
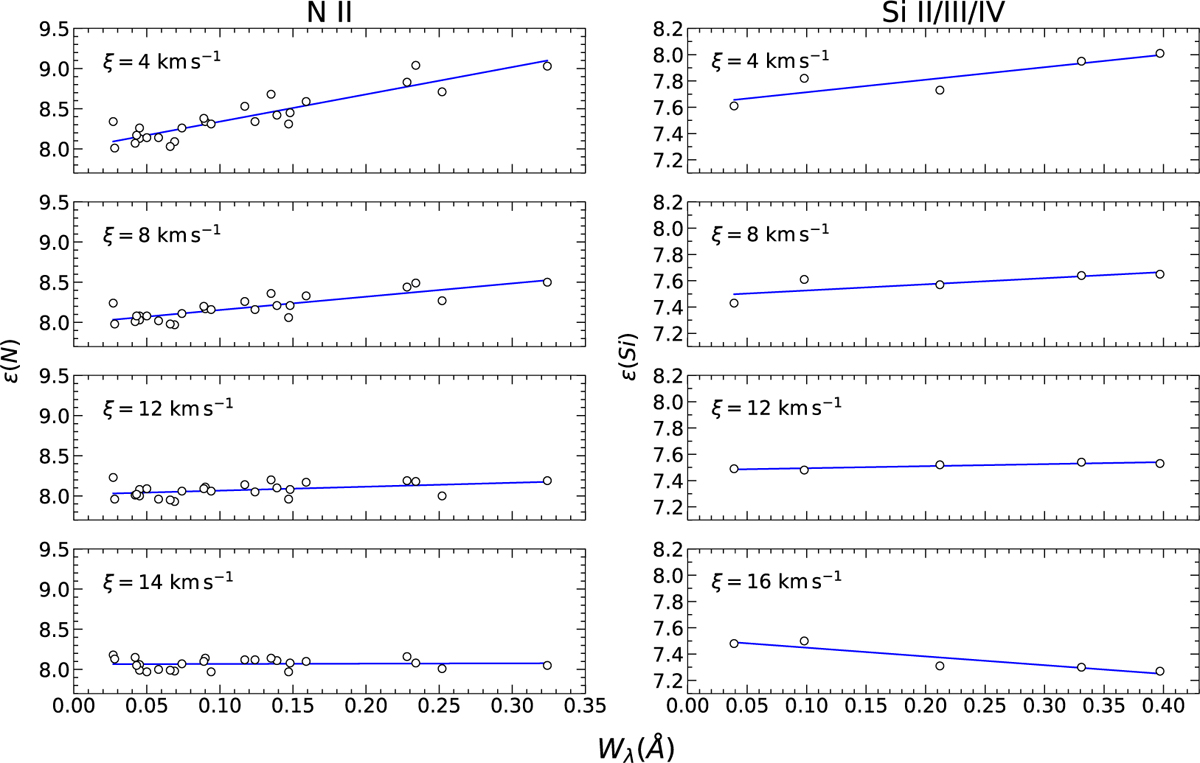
Constraining the microturbulent velocity for HD 119646. The nitrogen (left panels) and silicon abundances (right panels) are displayed as a function of equivalent width for varying values of microturbulence, as indicated. The blue lines depict the best linear fit to the data.
Current usage metrics show cumulative count of Article Views (full-text article views including HTML views, PDF and ePub downloads, according to the available data) and Abstracts Views on Vision4Press platform.
Data correspond to usage on the plateform after 2015. The current usage metrics is available 48-96 hours after online publication and is updated daily on week days.
Initial download of the metrics may take a while.