Fig. 4
Download original image
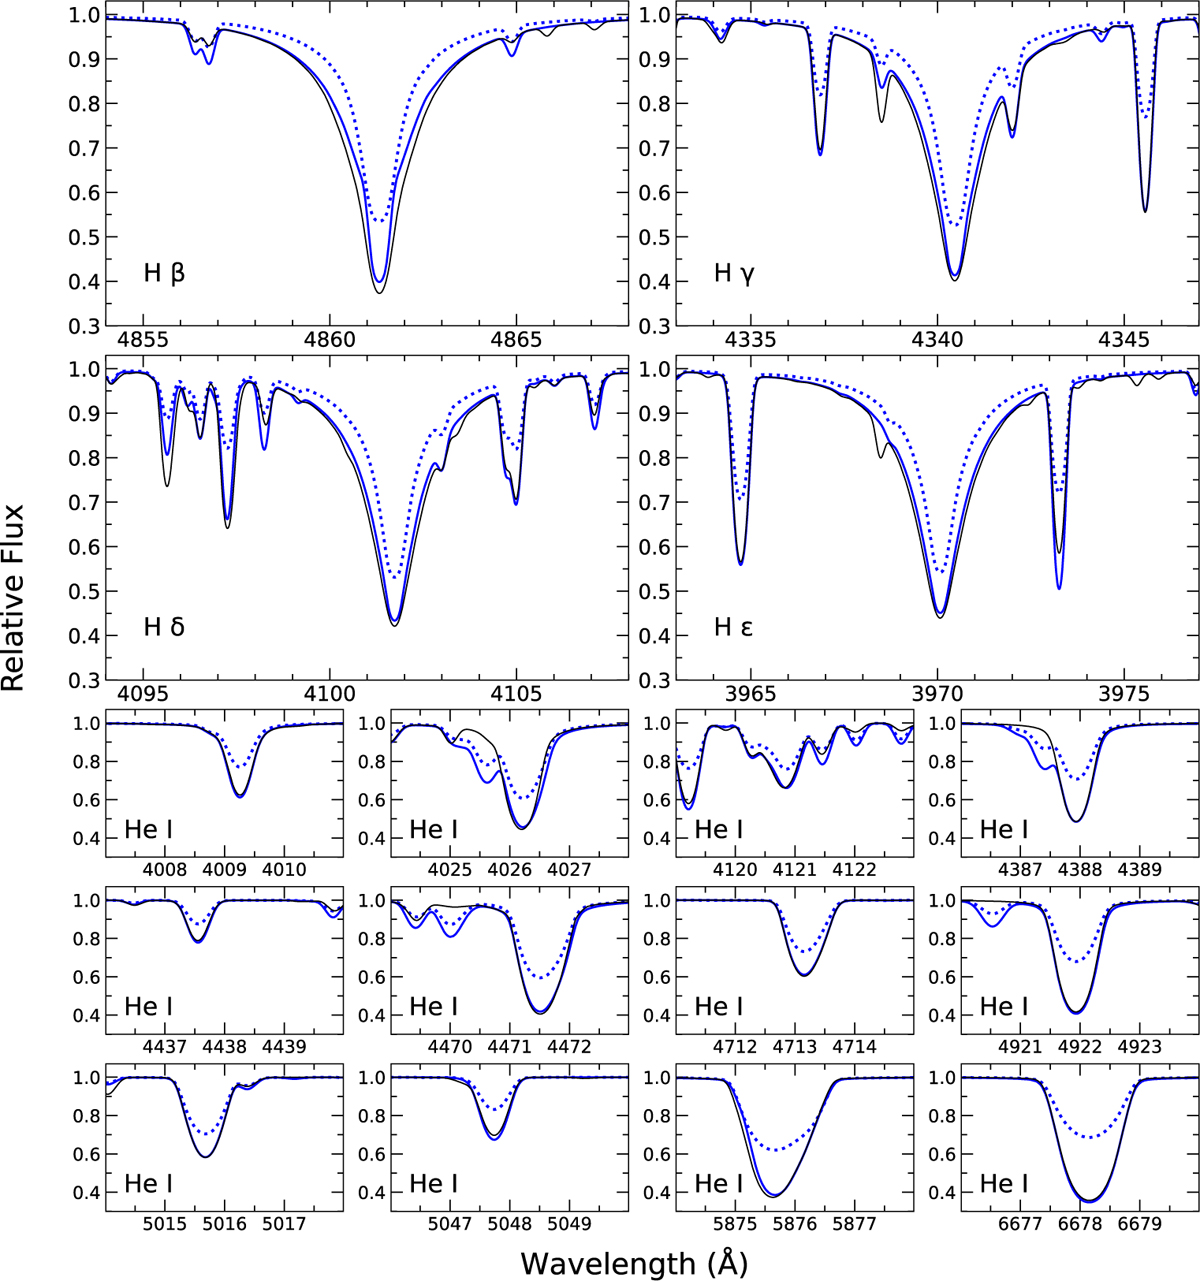
Comparison of Balmer lines Hβ, Hγ, Hδ, Hε, and selected lines of He I in synthetic spectra (Teff = 20 000 K, log g = 2.50, and ξ =10 km s−1 ) calculated with ADS (blue lines) and TLUSTY/SYNSPEC (black lines). The dotted blue lines correspond to a model computed with SURFACE only on an ATLAS 12 atmospheric structure, i.e. representing an LTE solution using otherwise the same input data as in the ADS non-LTE model.
Current usage metrics show cumulative count of Article Views (full-text article views including HTML views, PDF and ePub downloads, according to the available data) and Abstracts Views on Vision4Press platform.
Data correspond to usage on the plateform after 2015. The current usage metrics is available 48-96 hours after online publication and is updated daily on week days.
Initial download of the metrics may take a while.