Open Access
Fig. 3
Download original image
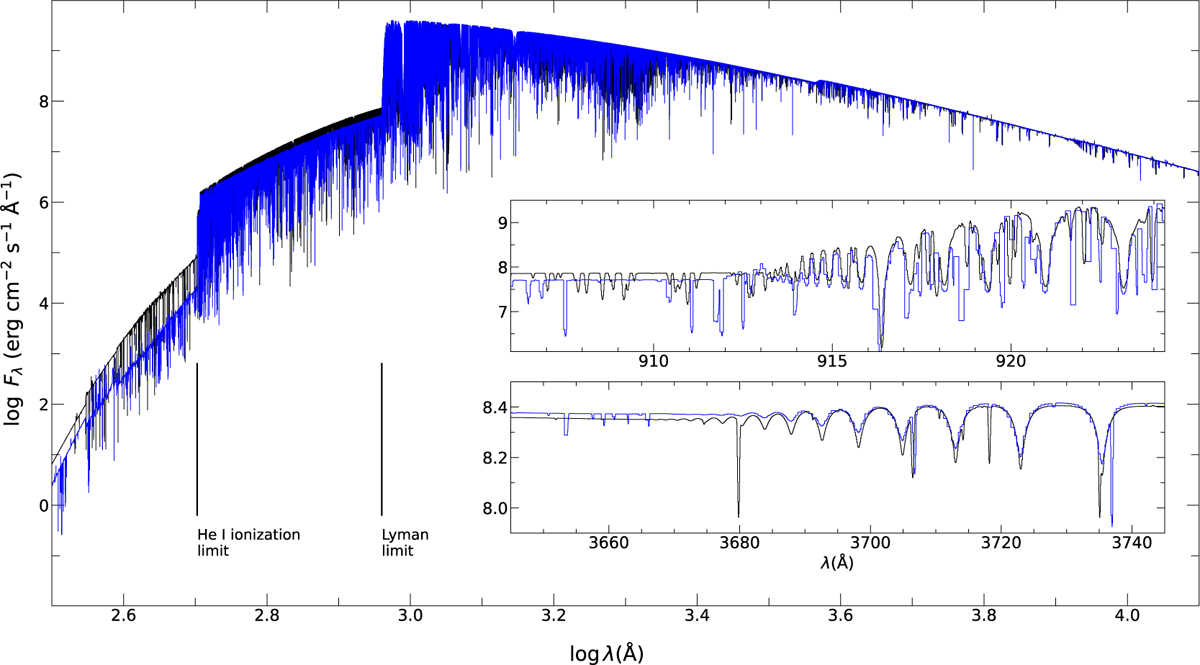
Comparison of DETAIL (blue) and TLUSTY (black lines) SEDs for a model with Teff = 20 000 K, log g = 2.50, and ξ = 10 km s−1. The locations of the Lyman- and He I ionisation limits are indicated towards the lower left. The insets focus on the Lyman and Balmer jumps, respectively.
Current usage metrics show cumulative count of Article Views (full-text article views including HTML views, PDF and ePub downloads, according to the available data) and Abstracts Views on Vision4Press platform.
Data correspond to usage on the plateform after 2015. The current usage metrics is available 48-96 hours after online publication and is updated daily on week days.
Initial download of the metrics may take a while.