Fig. 2
Download original image
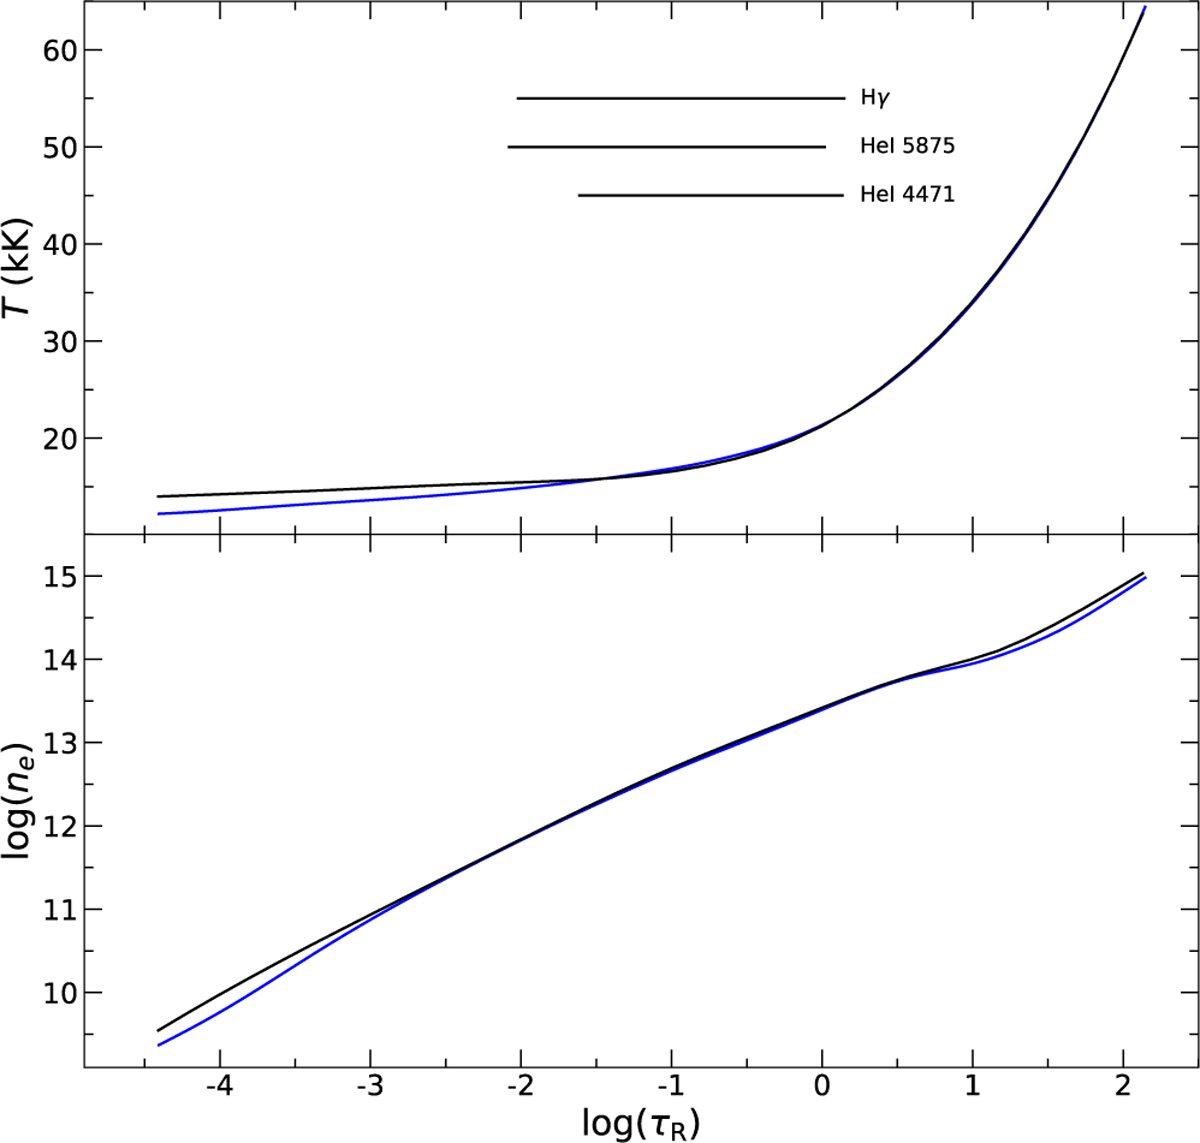
Comparison of an ATLAS 12 (blue) and TLUSTY (black lines) atmospheric structures for a model with Teff = 20 000 K, log g = 2.50, and ξ =10 km s−1. The upper and lower panel depict the run of temperature and the electron density, respectively, as a function of the Rosseland optical depth τR. The line formation regions of Hγ and two lines of He I are indicated in the upper panel. See the text for a discussion.
Current usage metrics show cumulative count of Article Views (full-text article views including HTML views, PDF and ePub downloads, according to the available data) and Abstracts Views on Vision4Press platform.
Data correspond to usage on the plateform after 2015. The current usage metrics is available 48-96 hours after online publication and is updated daily on week days.
Initial download of the metrics may take a while.