Fig. 16
Download original image
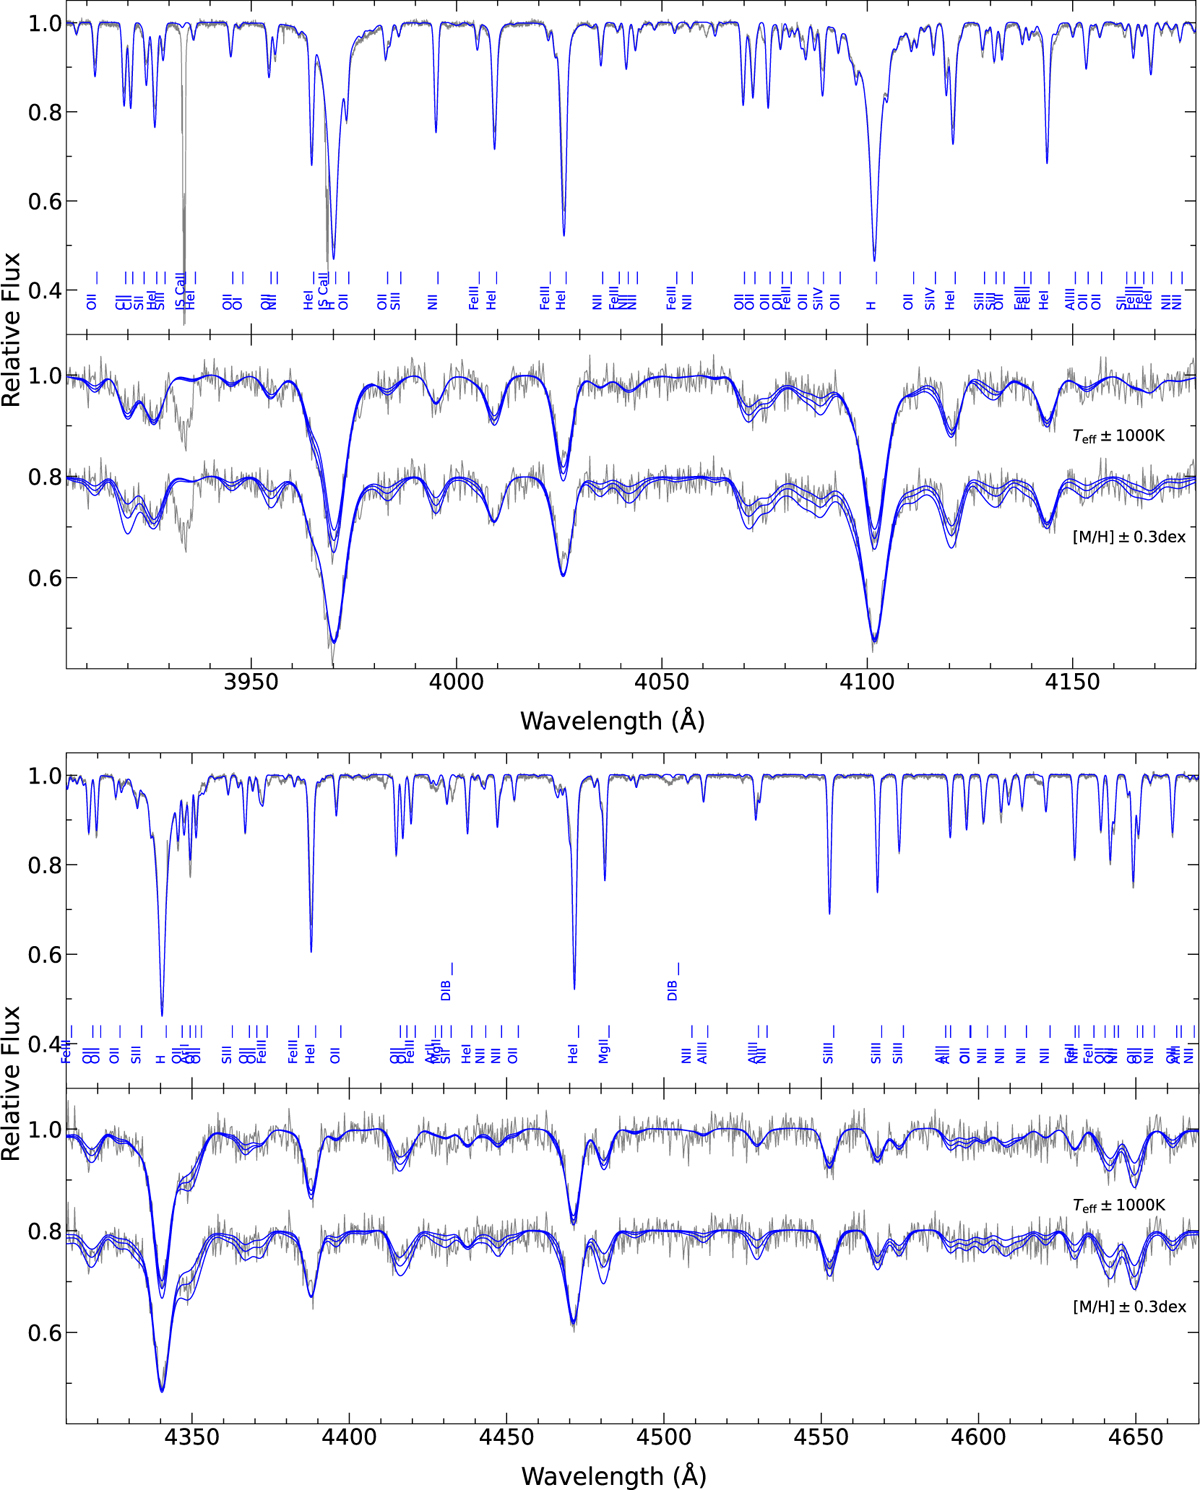
Testing the suitability of our modelling for analyses at intermediate spectral resolution, e.g. for extragalactic applications, for the blue spectral regions of about 3900–4180 Å (upper) and 4310–4670 Å (lower panel set). The upper panel of each set shows the comparison of our best-fit synthetic spectrum for HD 119646 (blue line) with the observed high-resolution spectrum (grey line). The important spectral features are identified, including interstellar features that were not modelled. The lower panels of each set show the same spectra, however degraded to R = 1000, with the observations degraded to a S/N = 50 and showing some degree of oversampling. Two sets of model curves are shown in these cases, exemplifying the impact of a Teff-variation by ±1000 K and the effects of a metallicity variation of ±0.3 dex, as indicated.
Current usage metrics show cumulative count of Article Views (full-text article views including HTML views, PDF and ePub downloads, according to the available data) and Abstracts Views on Vision4Press platform.
Data correspond to usage on the plateform after 2015. The current usage metrics is available 48-96 hours after online publication and is updated daily on week days.
Initial download of the metrics may take a while.