Fig. 15
Download original image
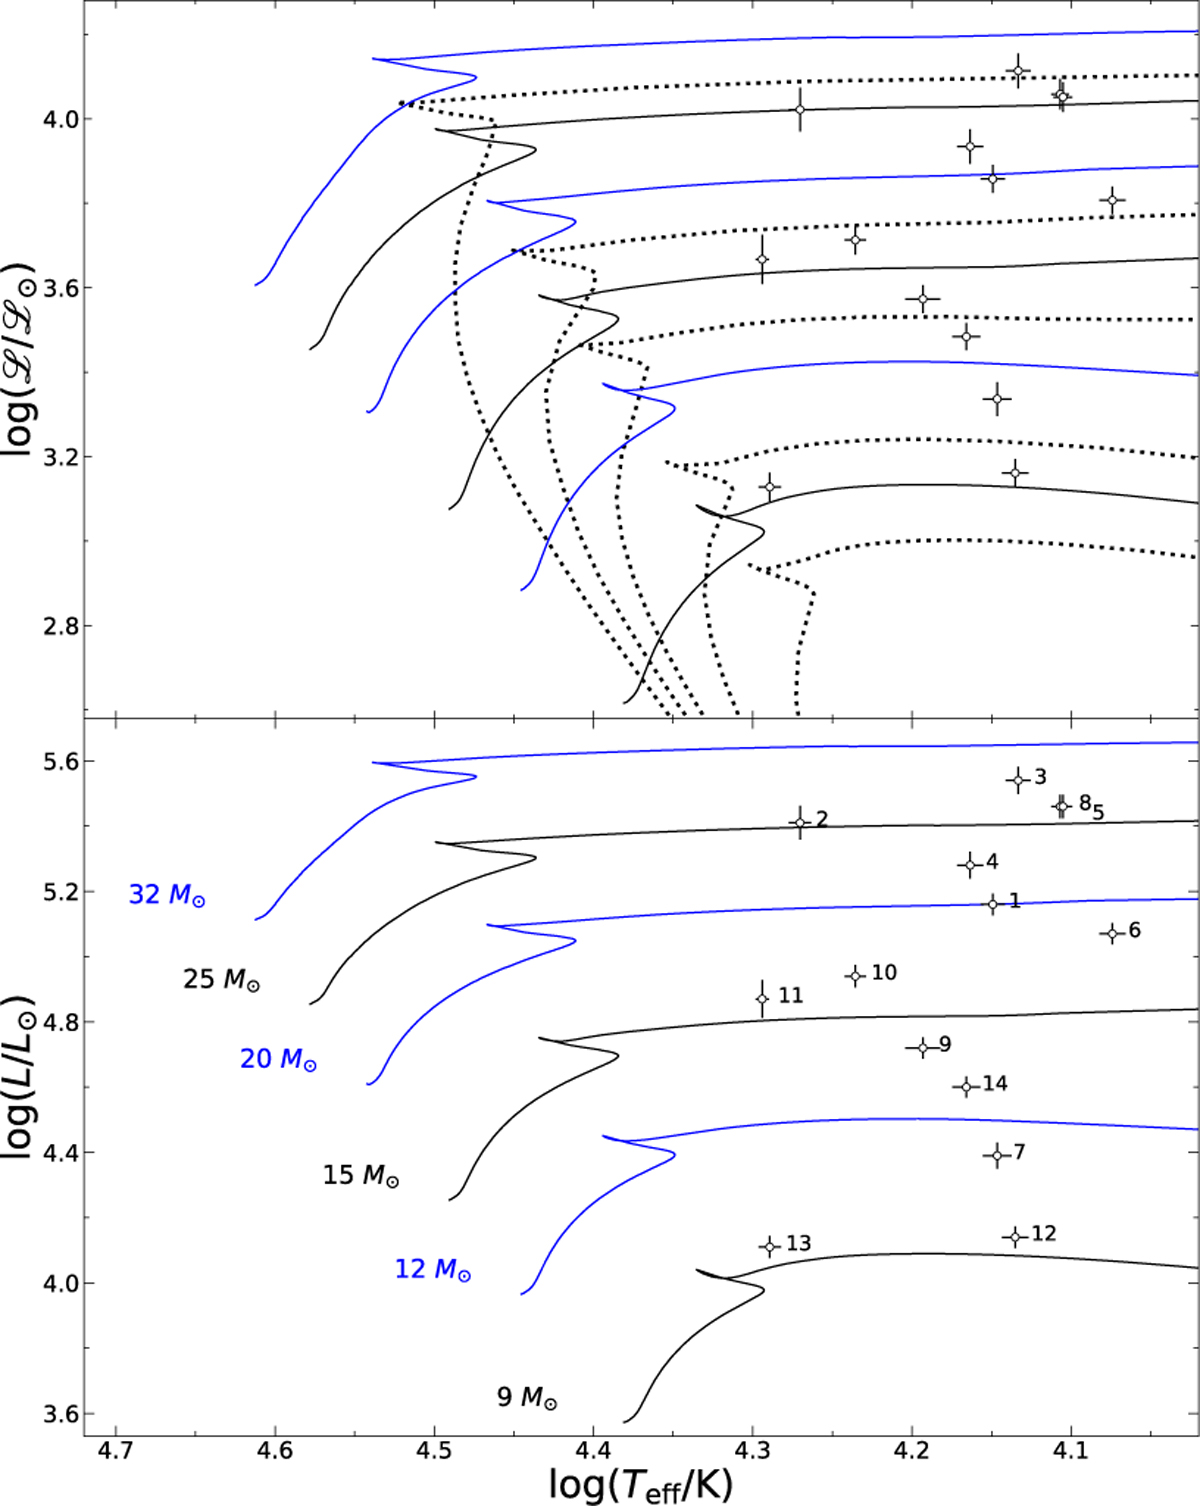
Location of the sample objects in two diagnostic diagrams compared to the loci of evolution tracks for stars rotating with Ωrot = 0.568 Ωcrit by Ekström et al. (2012), for various ZAMS-masses as indicated. Isochrones for the model grid, corresponding to ages of log τevol ∈ {6.85, 7.05, 7.20, 7.40, 7.60} are depicted as dotted lines in the upper panel (increasing in age from top to bottom). Upper panel: sHRD; lower panel: HRD. 1σ error bars are indicated.
Current usage metrics show cumulative count of Article Views (full-text article views including HTML views, PDF and ePub downloads, according to the available data) and Abstracts Views on Vision4Press platform.
Data correspond to usage on the plateform after 2015. The current usage metrics is available 48-96 hours after online publication and is updated daily on week days.
Initial download of the metrics may take a while.