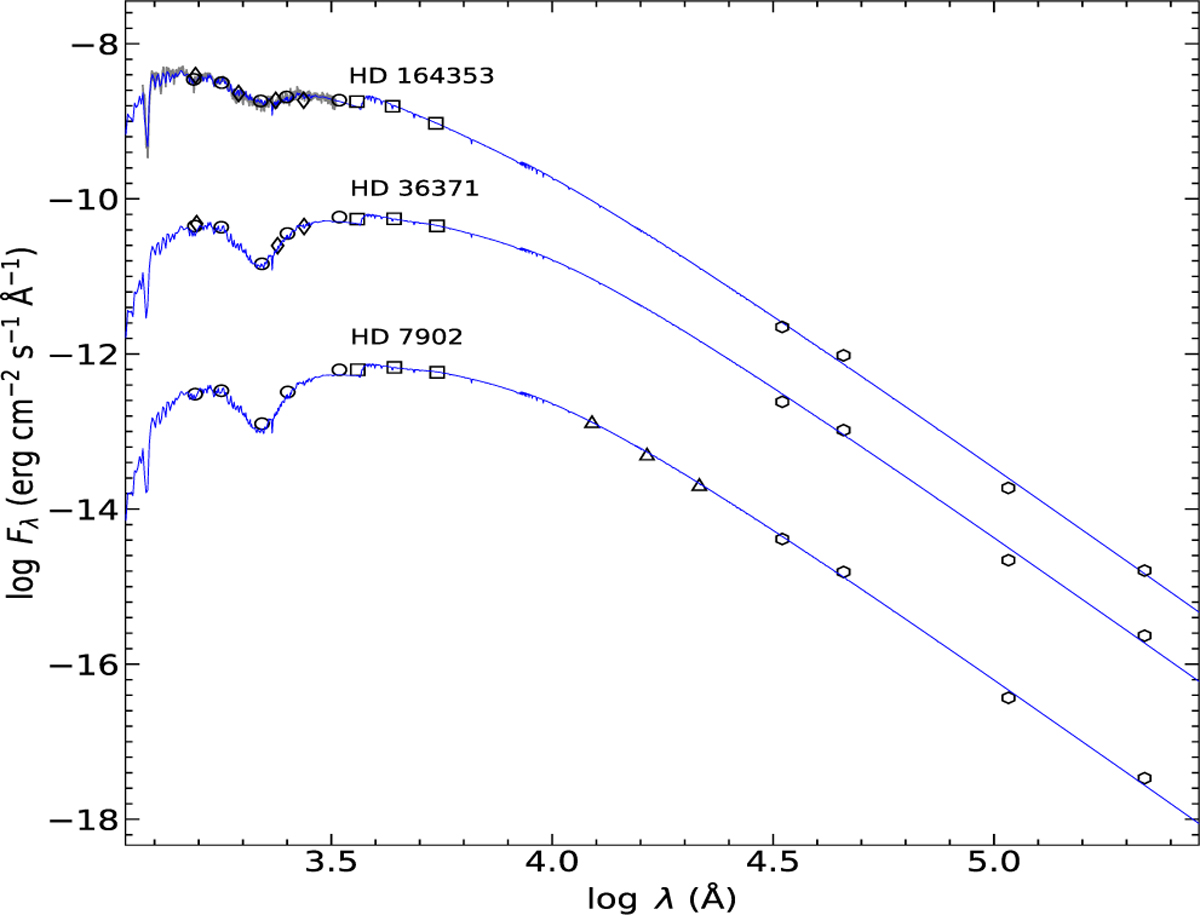
Fig. 14
Download original image
Examples of spectral energy distributions of sample stars. ATLAS9-SEDs, normalised in V and reddened according to values from Table 5 (blue lines) are compared to IuE spectrophotometry (grey lines) and photometric data in various wavelength bands: ANS (circles), TD1 (diamonds), Johnson (squares), 2MASS (triangles), and ALLWISE data (hexagons). Data with bad quality flags were removed. For better visibility, the SEDs and photometry of HD 164353 and HD 7902 were shifted by +1 and −1 dex, respectively.
Current usage metrics show cumulative count of Article Views (full-text article views including HTML views, PDF and ePub downloads, according to the available data) and Abstracts Views on Vision4Press platform.
Data correspond to usage on the plateform after 2015. The current usage metrics is available 48-96 hours after online publication and is updated daily on week days.
Initial download of the metrics may take a while.