Fig. 11
Download original image
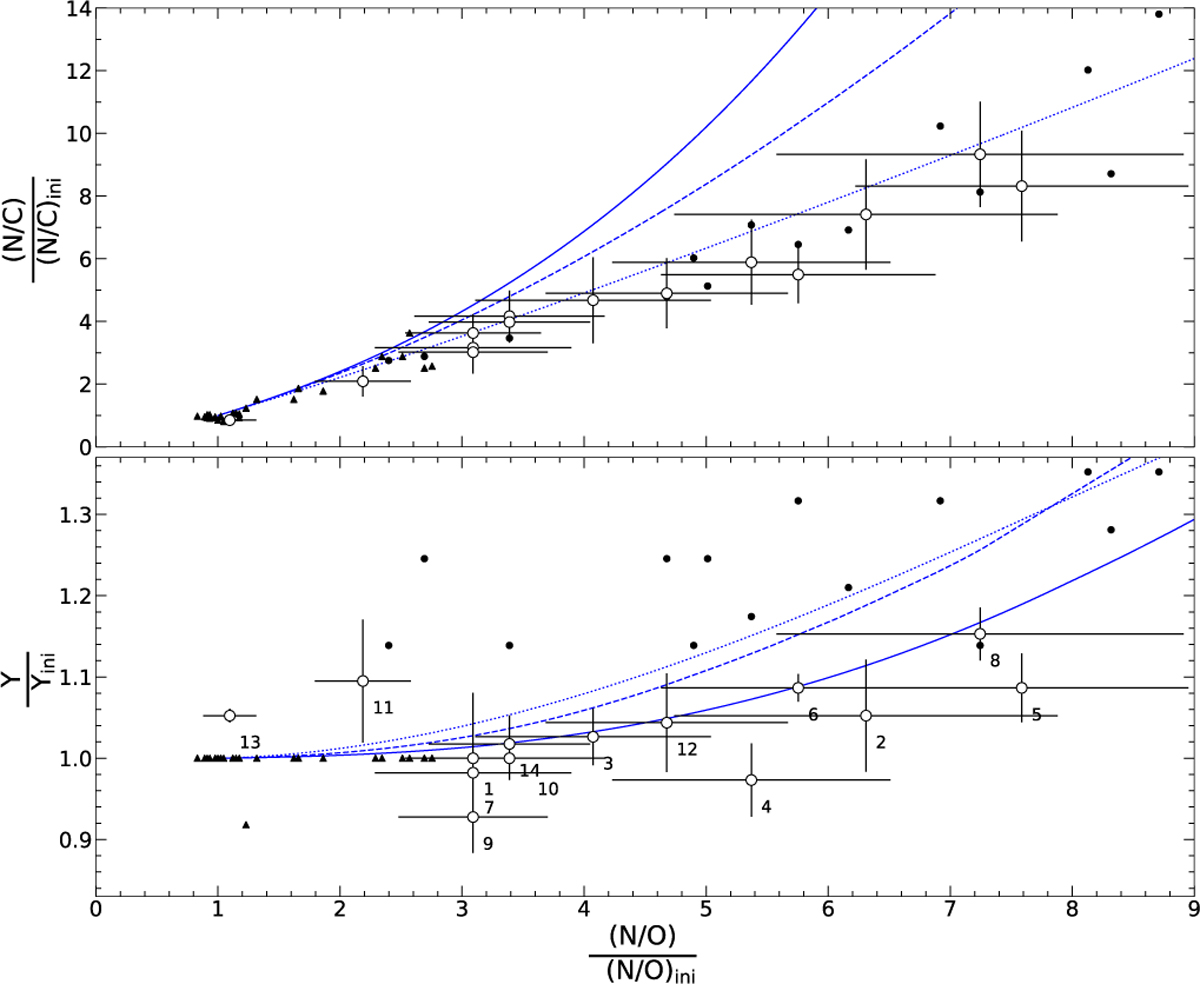
Nitrogen-to-carbon ratio (upper panel) and helium abundance (lower panel) versus nitrogen-to-oxygen ratio, normalised to cosmic abundance standard values (Nieva & Przybilla 2012). Objects from the present work (open symbols), B-type main-sequence stars (Nieva & Przybilla 2012, black triangles), and BA-type supergiants (Przybilla et al. 2010, black dots) are compared to predictions from stellar evolution models. Solid lines: 15 M⊙, Ωrot = 0.95 Ωcrit model by Georgy et al. (2013); dashed lines: 15 M⊙, Ωrot = 0.568 Ωcrit model by Ekström et al. (2012); dotted lines: 25 M⊙, Ωrot = 0.568 Ωcrit model by Ekström et al. (2012). For all tracks, a metallicity of Z =0.014 was assumed. Abundances in the models were normalised with respect to their initial model values.
Current usage metrics show cumulative count of Article Views (full-text article views including HTML views, PDF and ePub downloads, according to the available data) and Abstracts Views on Vision4Press platform.
Data correspond to usage on the plateform after 2015. The current usage metrics is available 48-96 hours after online publication and is updated daily on week days.
Initial download of the metrics may take a while.