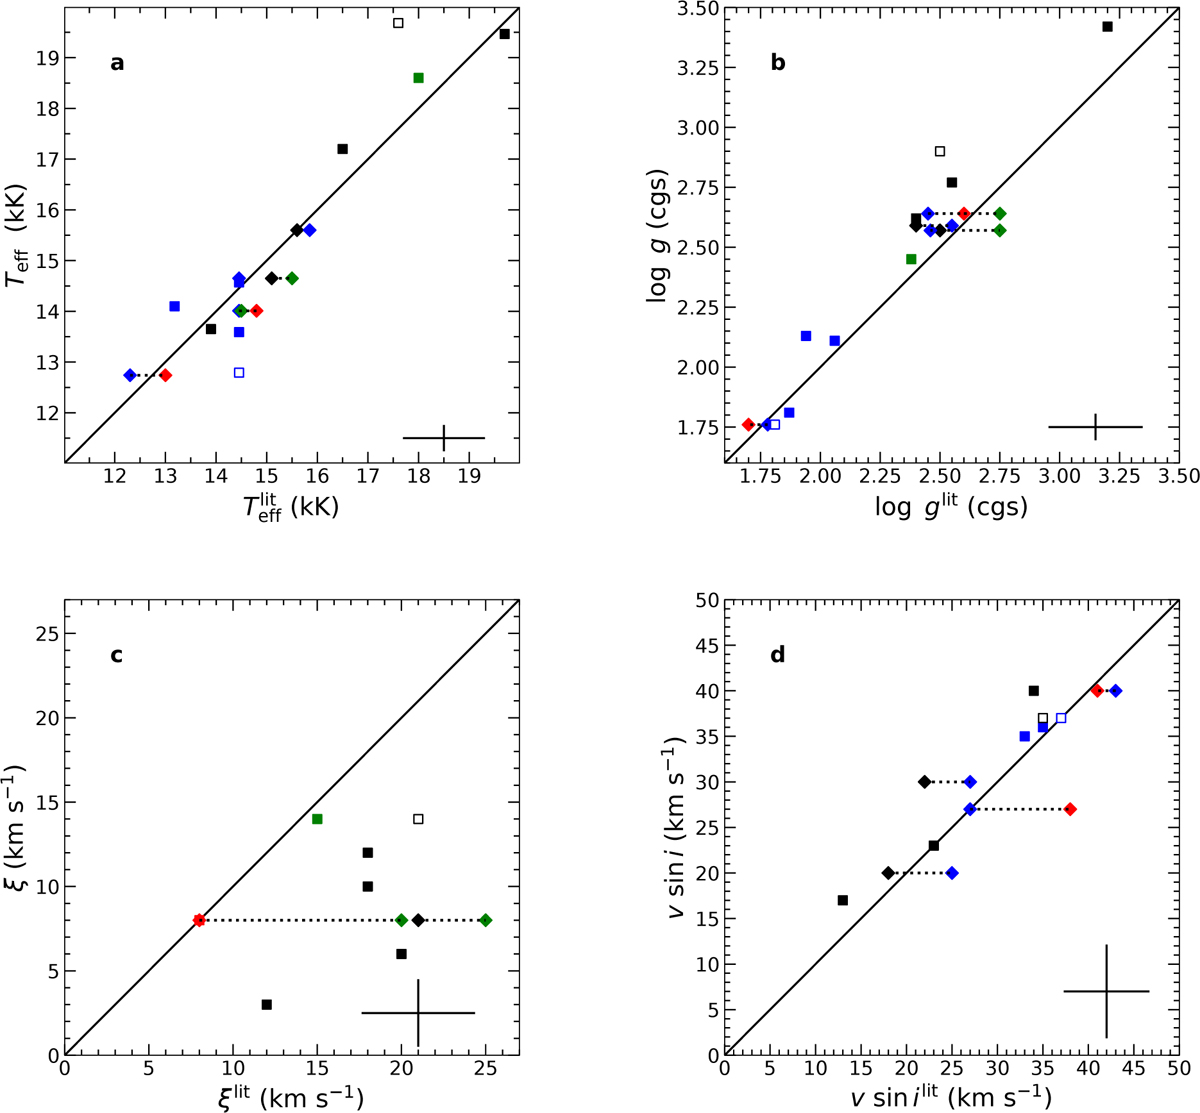
Fig. 10
Download original image
Comparison of values for effective temperature Teff (panel a), surface gravity log g (panel b), microturbulence ξ (panel c), and projected rotational velocity v sin i (panel d) as derived in the present work with previous studies: Fraser et al. (2010, black symbols), Simón-Díaz et al. (2017, blue), Markova & Puls (2008, red), and Searle et al. (2008, green). In cases in which an object is present in two or multiple studies the values are depicted by diamonds and connected with dotted lines. The symbols for HD 183143 and HD 119646 are marked by open symbols. For better visibility, the mean uncertainties are indicated in the lower right corner.
Current usage metrics show cumulative count of Article Views (full-text article views including HTML views, PDF and ePub downloads, according to the available data) and Abstracts Views on Vision4Press platform.
Data correspond to usage on the plateform after 2015. The current usage metrics is available 48-96 hours after online publication and is updated daily on week days.
Initial download of the metrics may take a while.