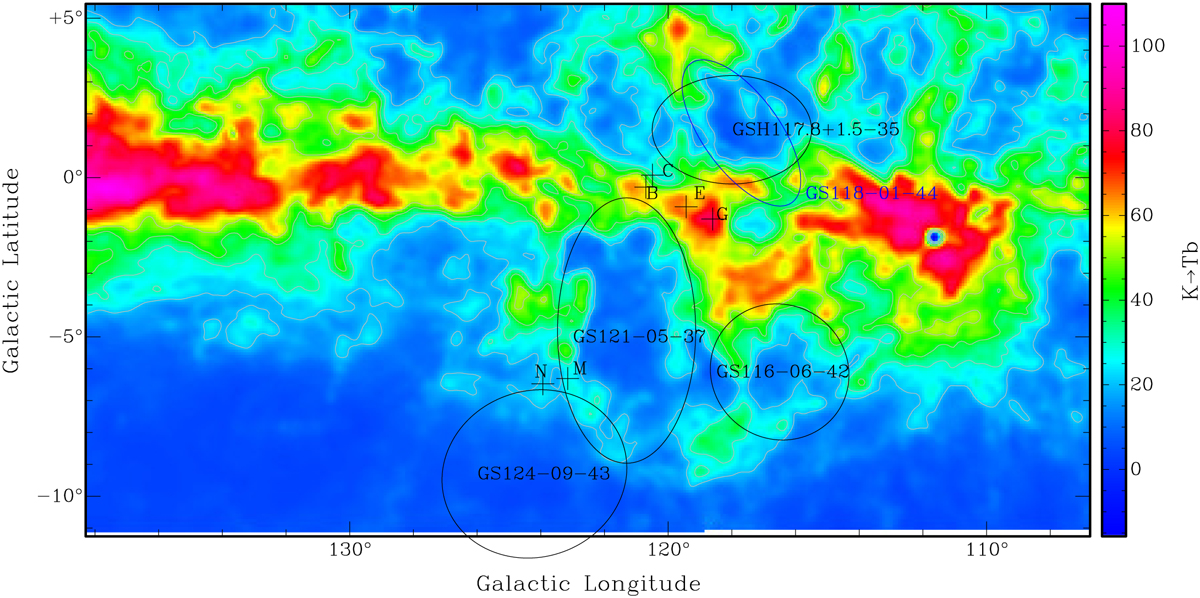
Fig. 6
Download original image
Averaged H i emission distribution of the region of GS 121−05−037 in the velocity range from −43.3 to −38.1 km s−1. Ellipses mark the H i supershells cataloged in I, as well as the supershell GSH 117.8+1.5 (Cichowolski et al. 2009). The black crosses and letters indicate the H ii regions, listed in Table 1, which are located between two supershells.
Current usage metrics show cumulative count of Article Views (full-text article views including HTML views, PDF and ePub downloads, according to the available data) and Abstracts Views on Vision4Press platform.
Data correspond to usage on the plateform after 2015. The current usage metrics is available 48-96 hours after online publication and is updated daily on week days.
Initial download of the metrics may take a while.