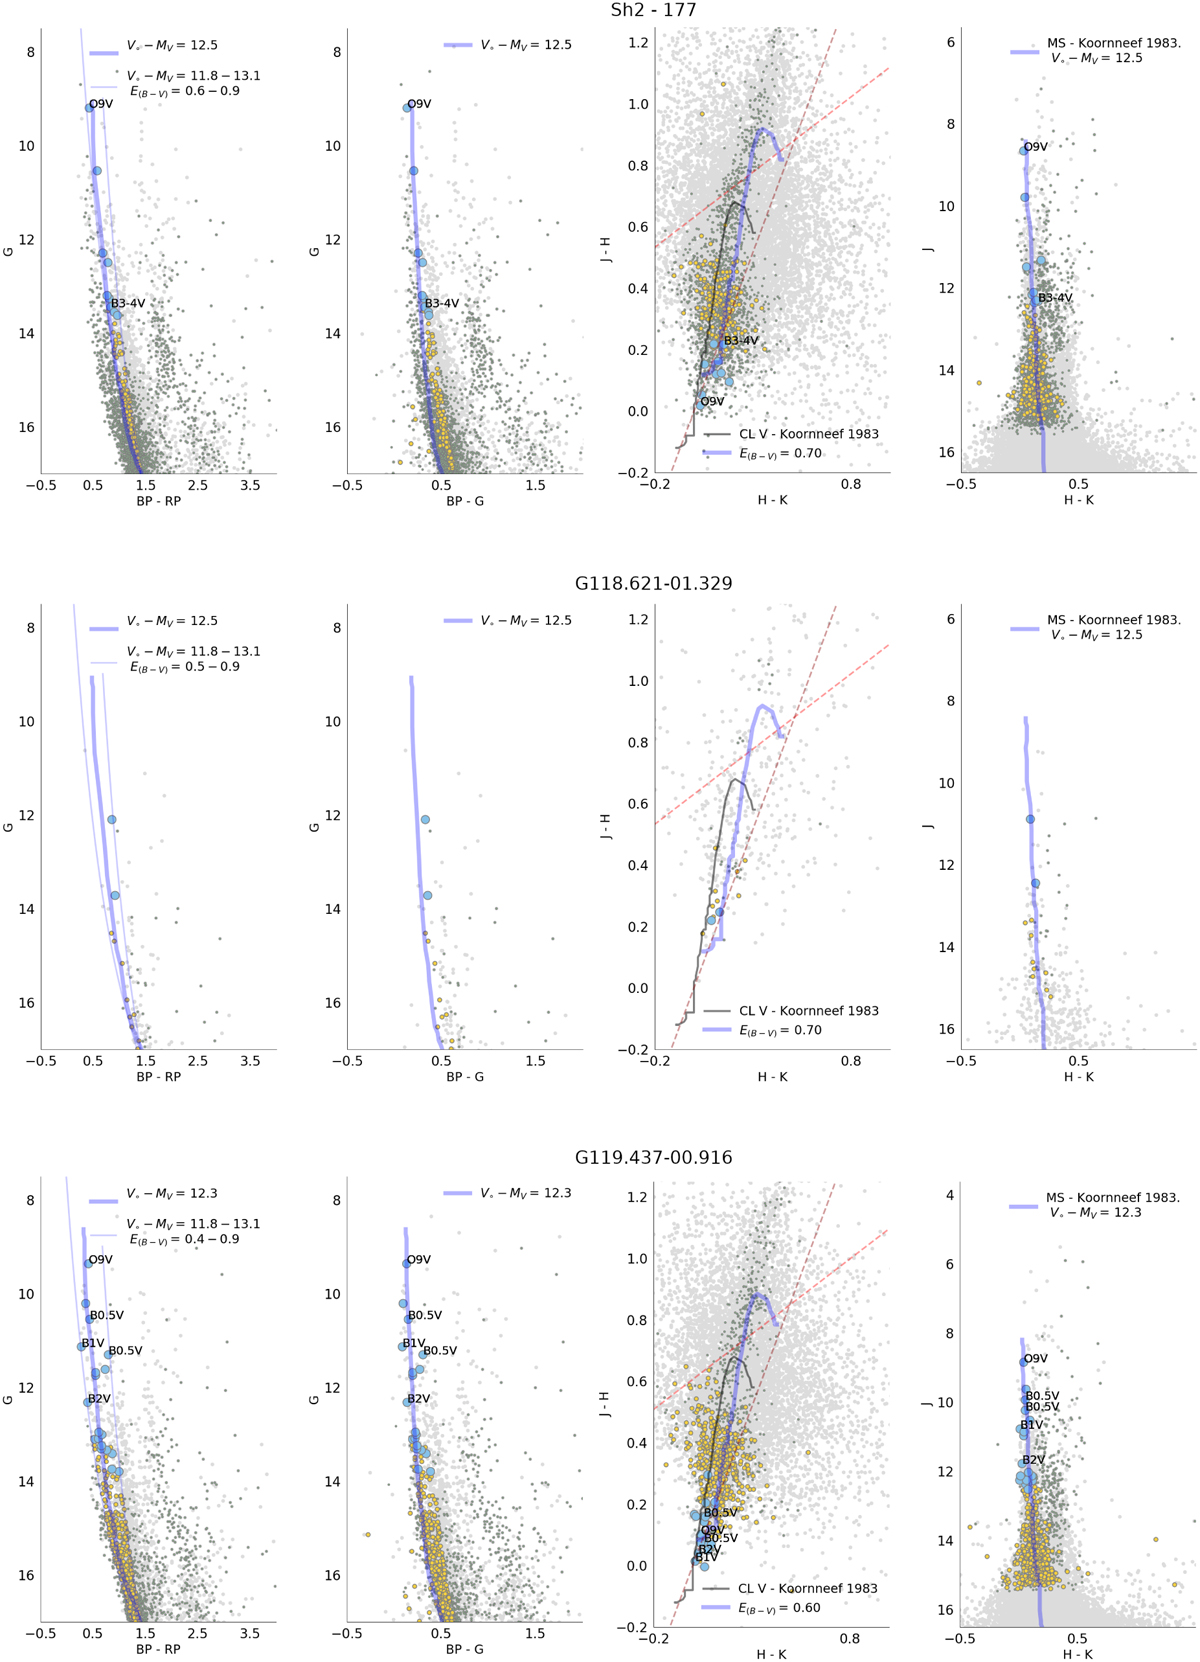
Fig. 5
Download original image
MS curve is represented with a thick blue line . Colored circles indicate the source is situated within 2.2 and 4.2 kpc, while gray dots show stars with distances lower than 2.2 kpc or higher than 4.2 kpc. Thinner blue lines enclose the selected region (see Sect. 3). Massive star candidates are shown with blue circles and labels indicate their previous ST classification. Small yellow circles are potential low-mass stars. Discarded sources are represented by green circles.
Current usage metrics show cumulative count of Article Views (full-text article views including HTML views, PDF and ePub downloads, according to the available data) and Abstracts Views on Vision4Press platform.
Data correspond to usage on the plateform after 2015. The current usage metrics is available 48-96 hours after online publication and is updated daily on week days.
Initial download of the metrics may take a while.