Fig. 2
Download original image
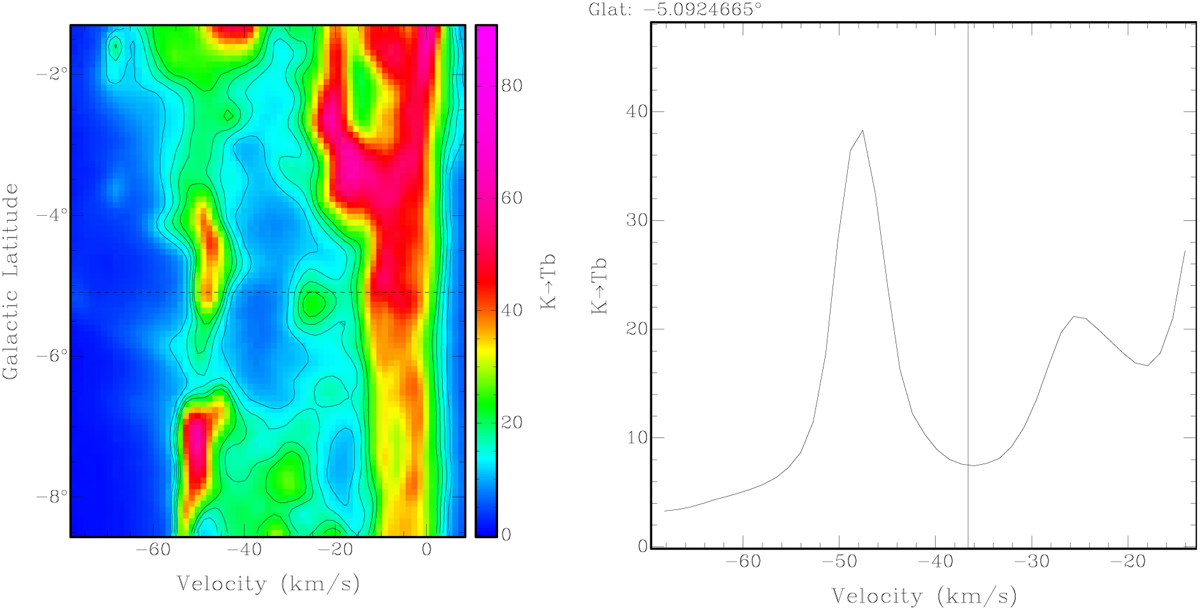
H i emission distribution in the V − l plane. Left panel: radial velocity-latitude H i image averaged in the Galactic longitude range from 120°. 8 to 121°.8. Contour levels are 12, 15, 18, and 21 K. The dashed line indicates the location of the cross-cut shown in the right panel. Right panel: cross-cut at b = −5°. 09 obtained from the left image. The central velocity of GS 121–05–037 is marked as a vertical black line at V = −37 km s−1.
Current usage metrics show cumulative count of Article Views (full-text article views including HTML views, PDF and ePub downloads, according to the available data) and Abstracts Views on Vision4Press platform.
Data correspond to usage on the plateform after 2015. The current usage metrics is available 48-96 hours after online publication and is updated daily on week days.
Initial download of the metrics may take a while.