Fig. 1
Download original image
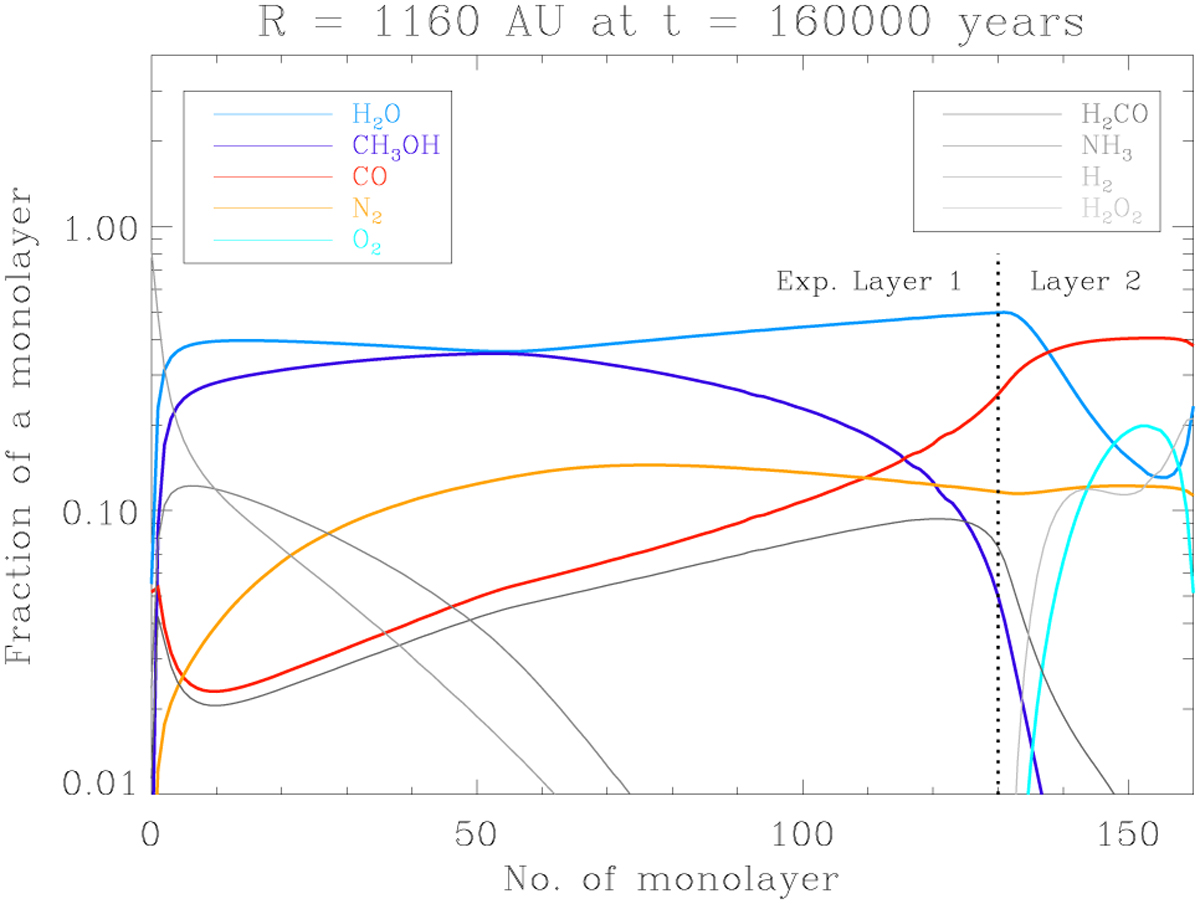
Predicted molecular fractional abundances for each layer of an ice mantle in a region close to the dust peak. 0 on the x-axis corresponds to the grain surface. The vertical line marks the division of monolayers that were used to calculate the average composition in the experimental layers 1 and 2. Coloured lines highlight the species used in our experiments.
Current usage metrics show cumulative count of Article Views (full-text article views including HTML views, PDF and ePub downloads, according to the available data) and Abstracts Views on Vision4Press platform.
Data correspond to usage on the plateform after 2015. The current usage metrics is available 48-96 hours after online publication and is updated daily on week days.
Initial download of the metrics may take a while.