Open Access
Fig. 9
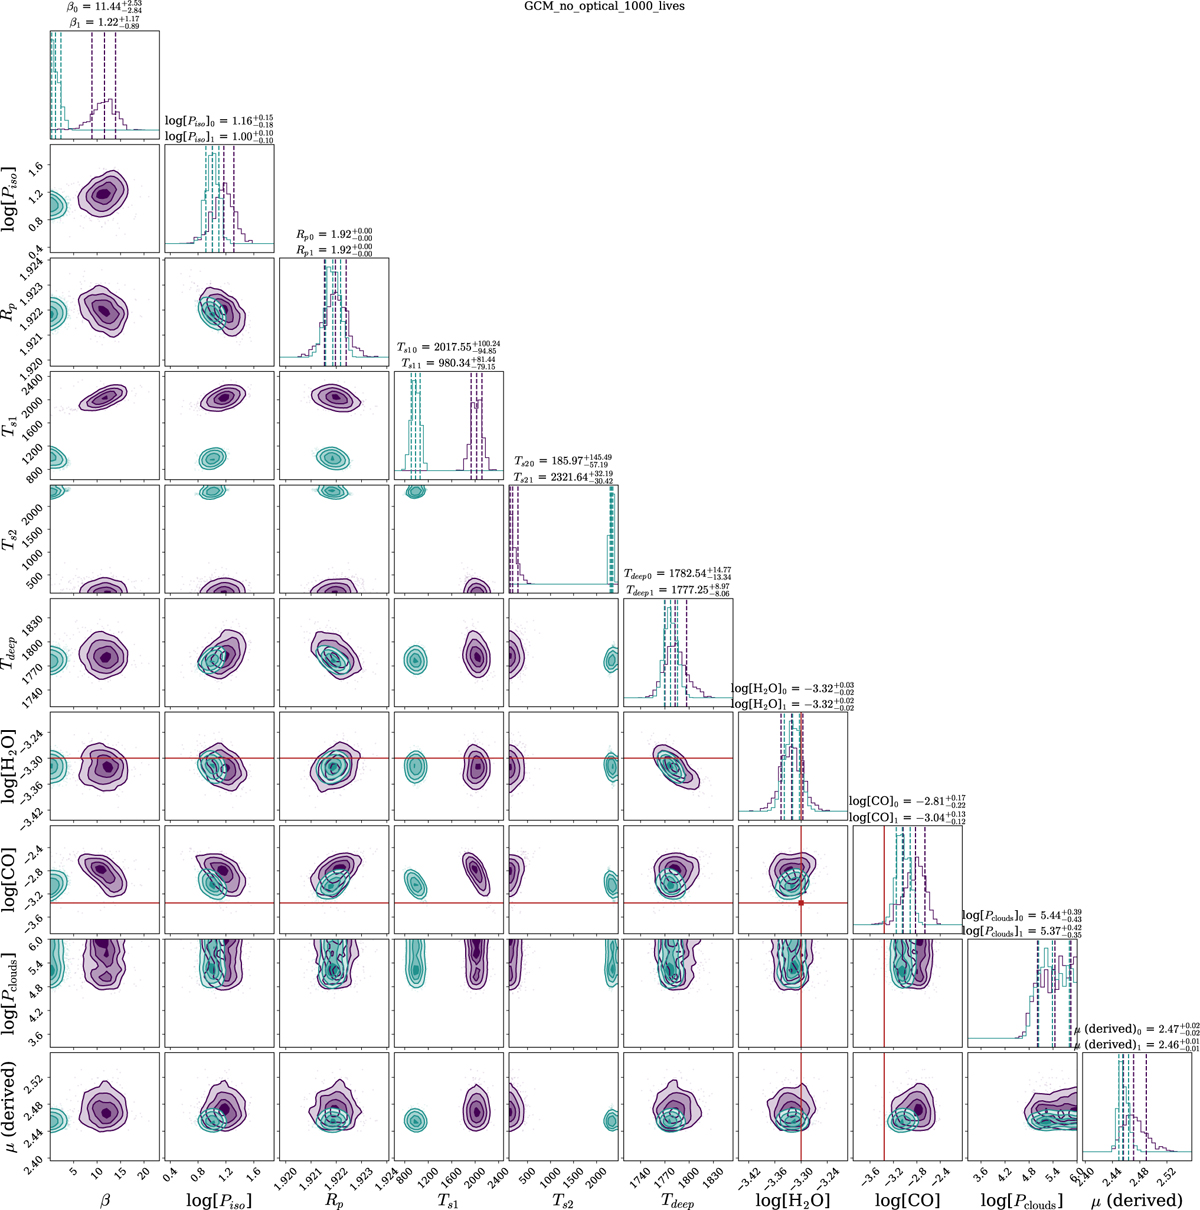
Download original image
Posterior distribution for the case where we used a WASP-121b GCM’s synthetic atmosphere as input and employing only H2O and CO a trace gases. The red lines correspond to the input deep abundances from the GCM model atmosphere.
Current usage metrics show cumulative count of Article Views (full-text article views including HTML views, PDF and ePub downloads, according to the available data) and Abstracts Views on Vision4Press platform.
Data correspond to usage on the plateform after 2015. The current usage metrics is available 48-96 hours after online publication and is updated daily on week days.
Initial download of the metrics may take a while.