Fig. 13
Download original image
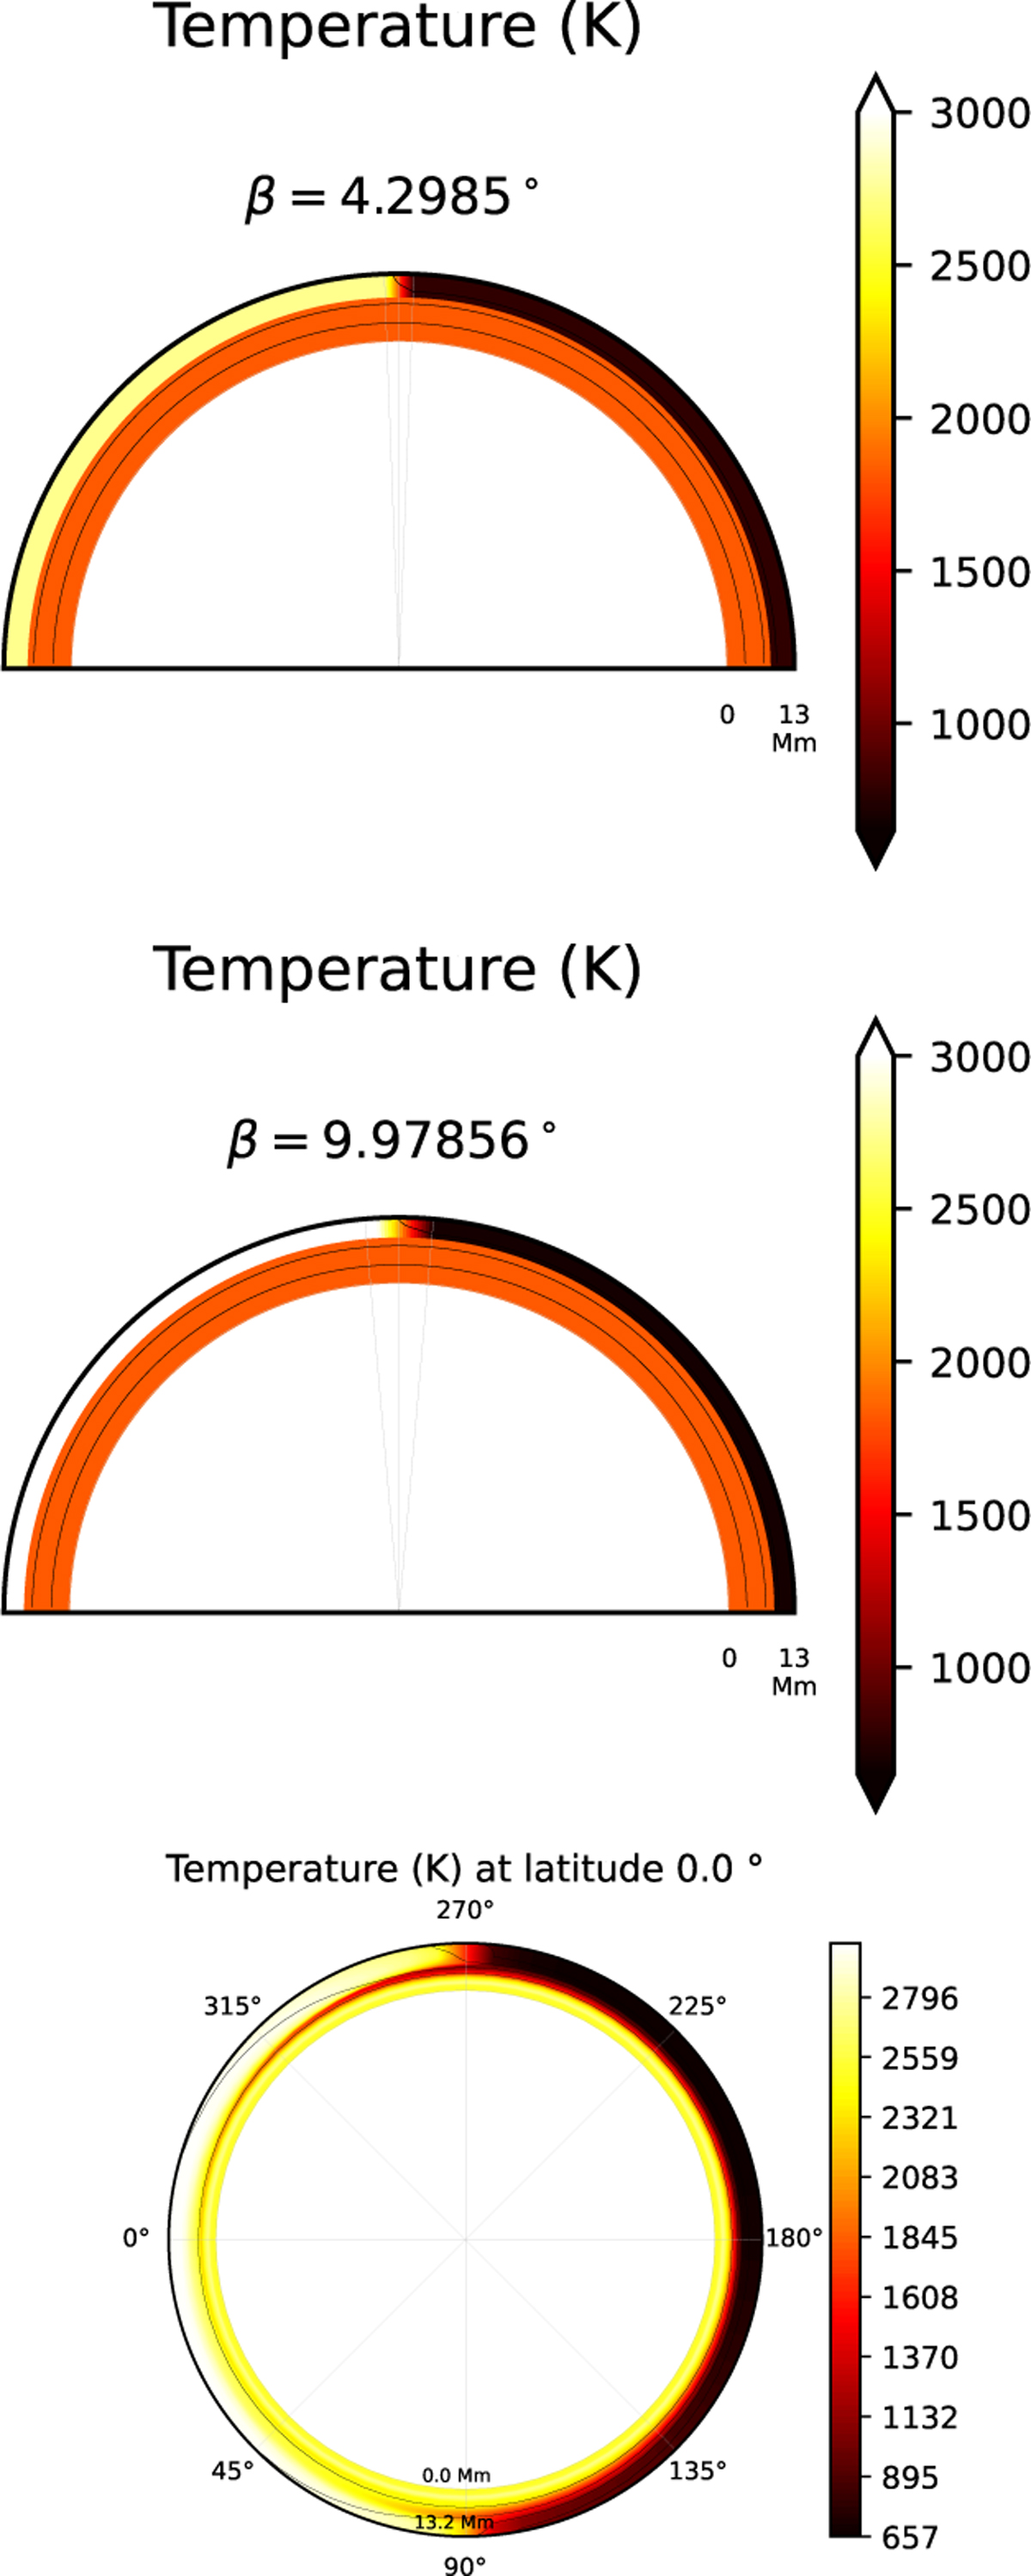
Top and middle: temperature model for the two different solutions found in the GCM retrieval with optical absorbers. For visual reasons, the size of the atmosphere has been doubled. The temperature structure in the top represents the one of the first solution, the green one in Fig. 9. In the middle, there is the thermal structure corresponding to the second, violet solution of Fig. 14. Bottom: temperature map (equatorial cut) of WASP-121 b GCM simulation.
Current usage metrics show cumulative count of Article Views (full-text article views including HTML views, PDF and ePub downloads, according to the available data) and Abstracts Views on Vision4Press platform.
Data correspond to usage on the plateform after 2015. The current usage metrics is available 48-96 hours after online publication and is updated daily on week days.
Initial download of the metrics may take a while.