Fig. 5.
Download original image
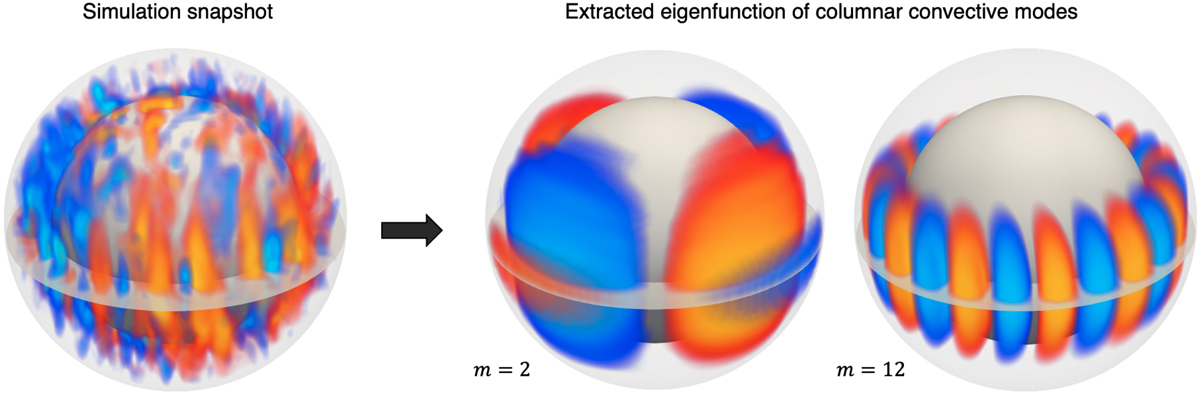
Three-dimensional visualization of the columnar convective modes. Left: snapshot of pressure perturbation (nonaxisymmetric component) from the nonlinear simulation shown as a 3D volume rendering. The red-yellow and blue-cyan parts correspond to the regions with positive and negative pressure perturbations, respectively. Right: eigenfunctions of pressure perturbation of the columnar convective modes extracted from the simulation data using SVD. The cases with m = 2 and m = 12 are shown.
Current usage metrics show cumulative count of Article Views (full-text article views including HTML views, PDF and ePub downloads, according to the available data) and Abstracts Views on Vision4Press platform.
Data correspond to usage on the plateform after 2015. The current usage metrics is available 48-96 hours after online publication and is updated daily on week days.
Initial download of the metrics may take a while.