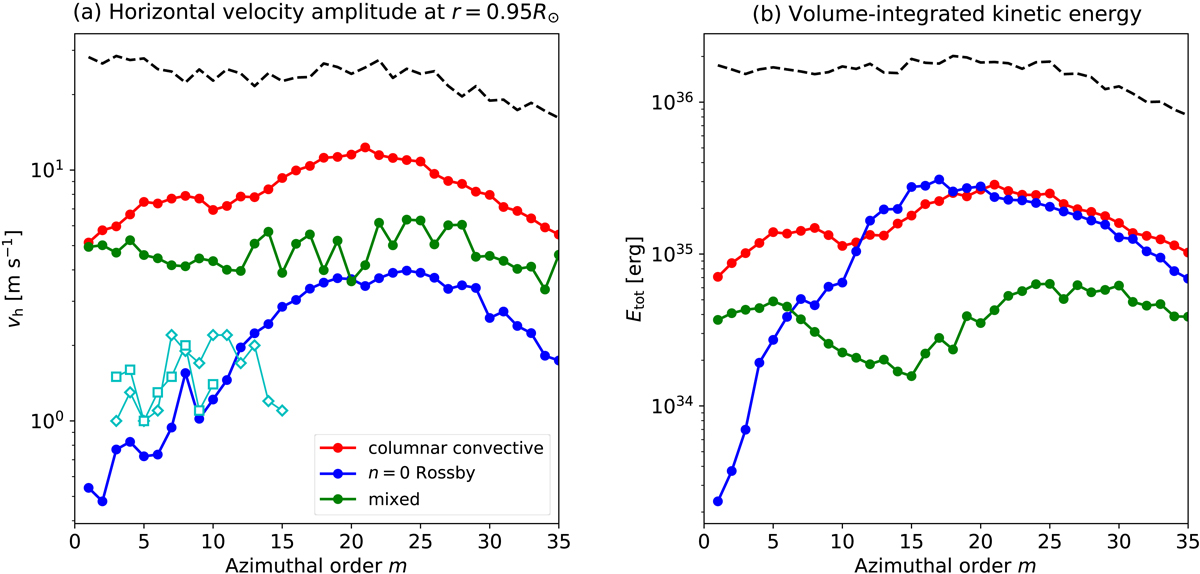
Fig. 15.
Download original image
Spectra of the equatorial modes. (a) Maximum horizontal velocity vh of the equatorial modes near the top boundary r = 0.95 R⊙ at each azimuthal order m. The red, blue, and green points represent the ζz-symmetric columnar convective modes, n = 0 equatorial Rossby modes, and the mixed Rossby modes, respectively. The black dashed line represents the overall power of the convection simulation (including modes at high latitudes and stochastic convective motions). The cyan diamonds and squares denote the (rms) horizontal velocity amplitudes of the observed Rossby modes near the solar surface obtained by Liang et al. (2019) and Gizon et al. (2021), respectively. (b) Spectra of the volume-integrated kinetic energy of the equatorial modes.
Current usage metrics show cumulative count of Article Views (full-text article views including HTML views, PDF and ePub downloads, according to the available data) and Abstracts Views on Vision4Press platform.
Data correspond to usage on the plateform after 2015. The current usage metrics is available 48-96 hours after online publication and is updated daily on week days.
Initial download of the metrics may take a while.