Open Access
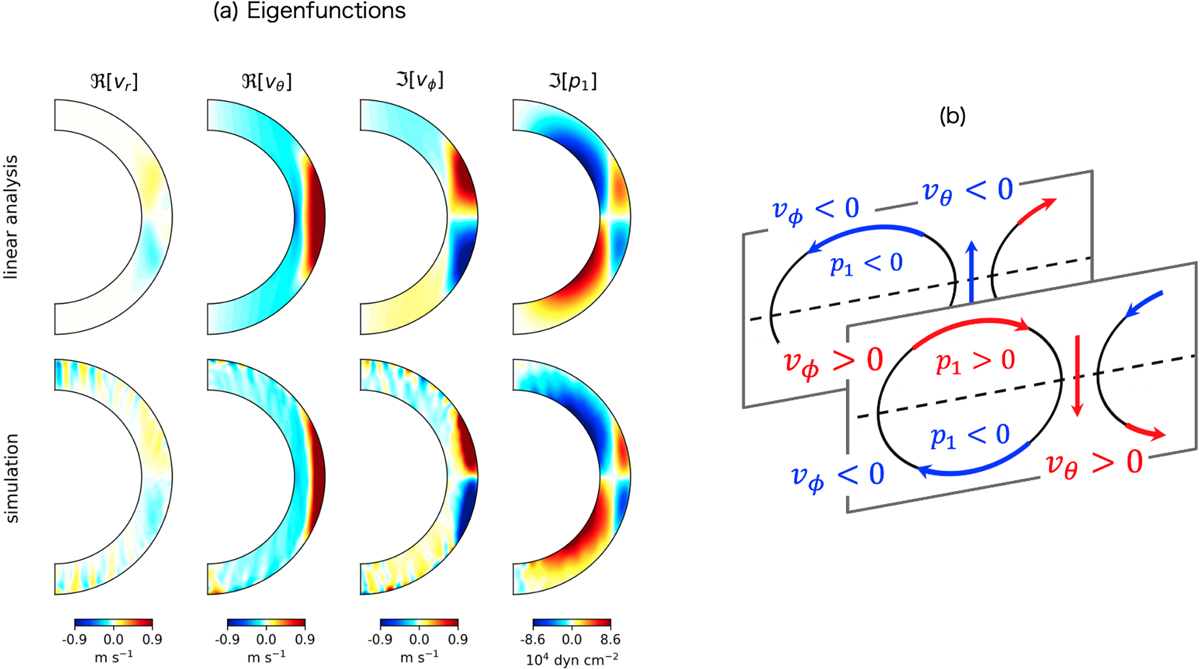
Fig. 13.
Download original image
Eigenfunctions of the retrograde-propagating mixed Rossby mode (n = 1 equatorial Rossby mode). (a) Meridional cuts of the eigenfunctions at m = 2. The lower and upper panels respectively show the results extracted from the simulation and from the linear analysis. (b) Schematic illustration of this mode.
Current usage metrics show cumulative count of Article Views (full-text article views including HTML views, PDF and ePub downloads, according to the available data) and Abstracts Views on Vision4Press platform.
Data correspond to usage on the plateform after 2015. The current usage metrics is available 48-96 hours after online publication and is updated daily on week days.
Initial download of the metrics may take a while.