Open Access
Fig. 1.
Download original image
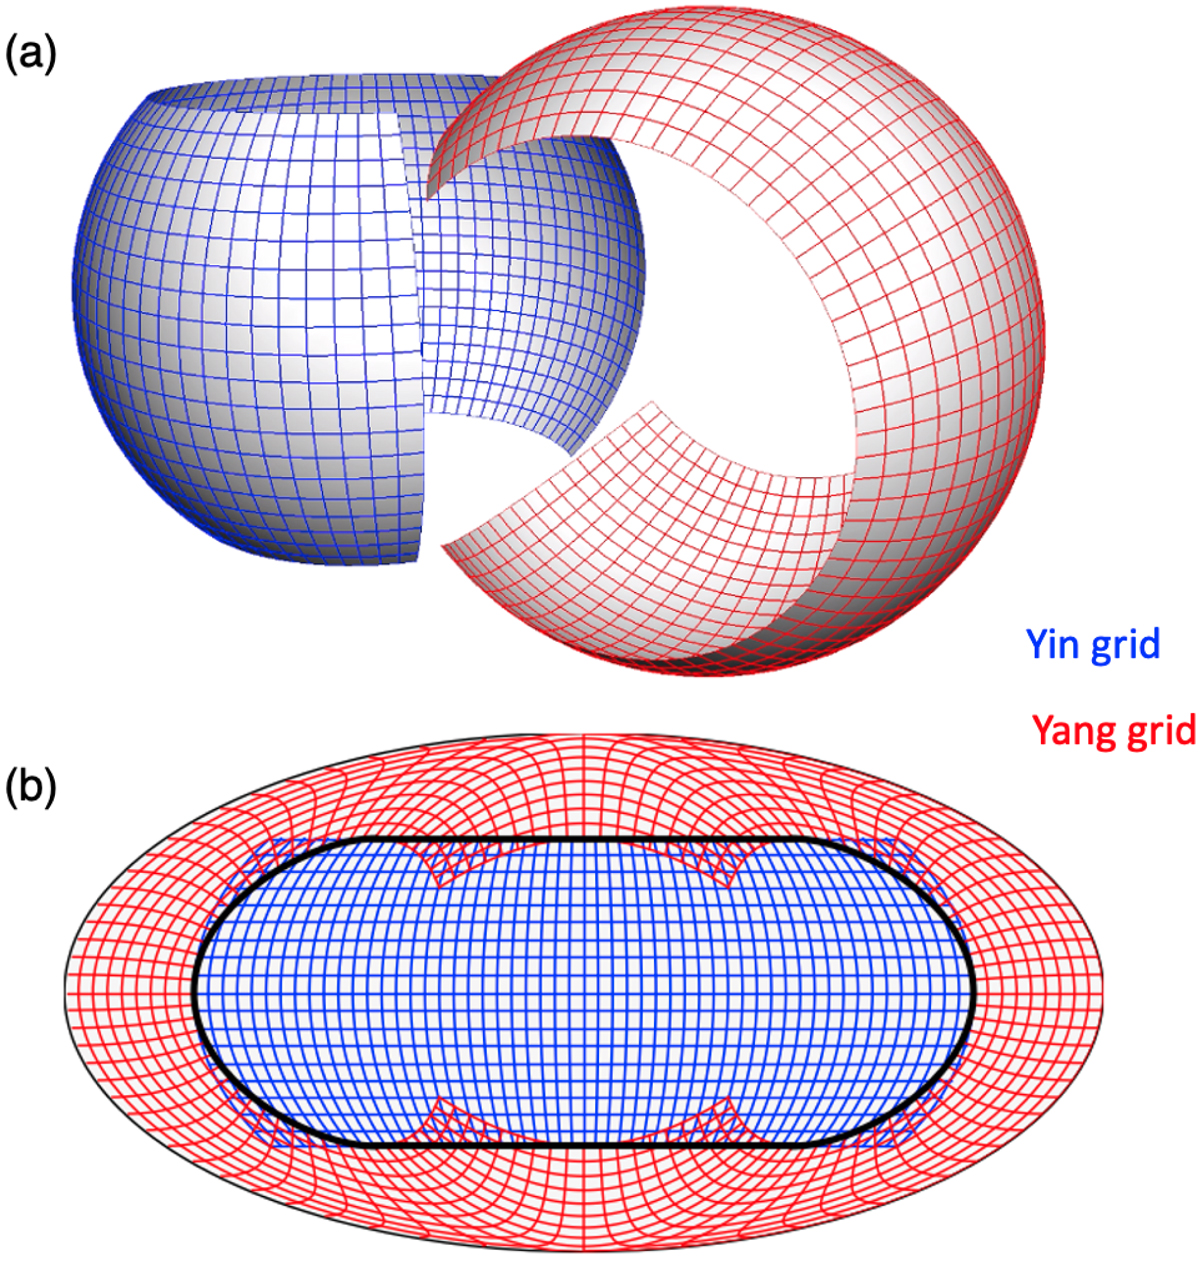
Yin-Yang grid used in our simulation. (a) Three-dimensional view of the Yin and Yang grids. The blue and red lines show the Yin and Yang coordinates, respectively. (b) Mollweide projection of the Yin-Yang grid. The thick black curve denotes the location where the horizontal boundary condition is set in our code.
Current usage metrics show cumulative count of Article Views (full-text article views including HTML views, PDF and ePub downloads, according to the available data) and Abstracts Views on Vision4Press platform.
Data correspond to usage on the plateform after 2015. The current usage metrics is available 48-96 hours after online publication and is updated daily on week days.
Initial download of the metrics may take a while.