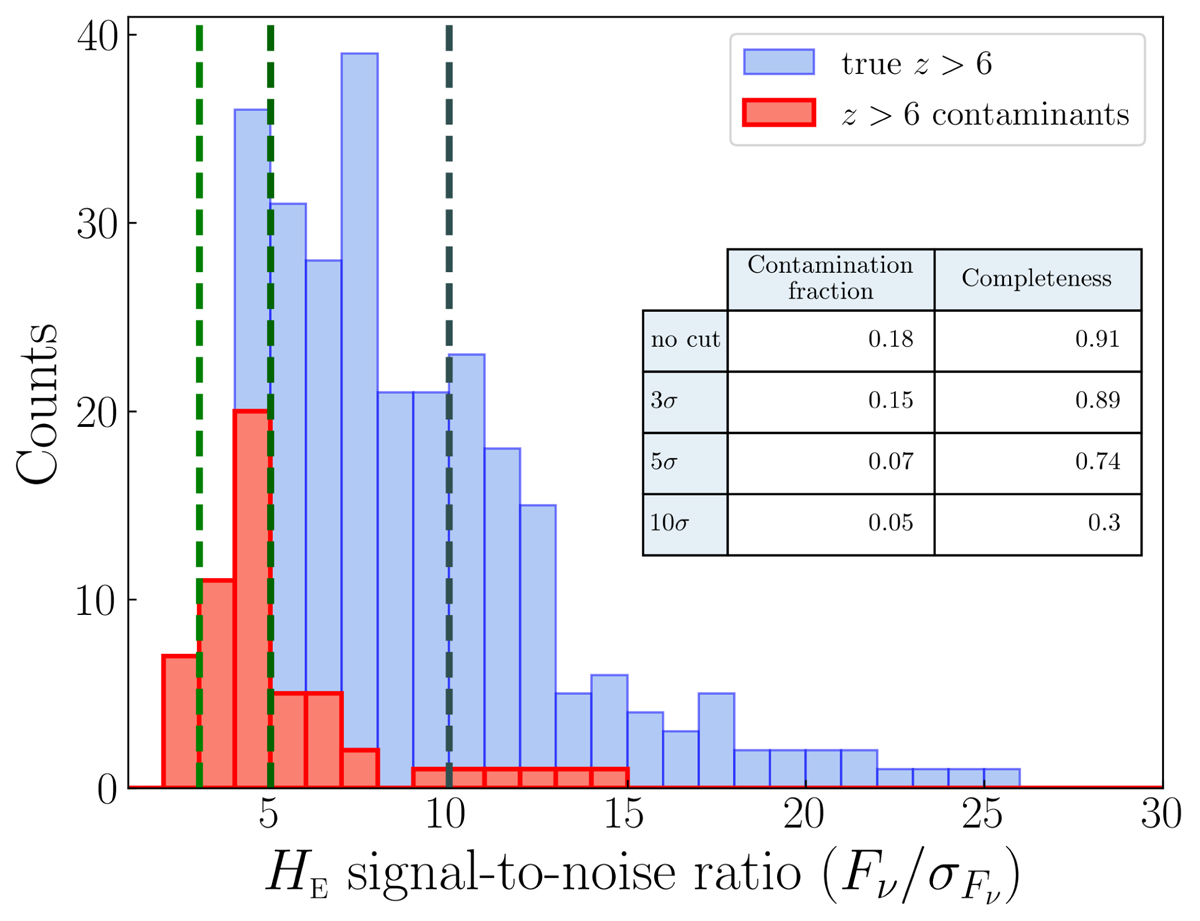
Fig. 6.
Download original image
Histogram of the HE-band S/N. Contaminants and true z > 6 galaxies as identified from Euclid data alone are displayed in red and blue graphs, respectively. The vertical dashed lines indicate the 3σ, 5σ, and 10σ detection cutoffs. The contamination fraction and completeness computed for the three cuts are indicated in the table.
Current usage metrics show cumulative count of Article Views (full-text article views including HTML views, PDF and ePub downloads, according to the available data) and Abstracts Views on Vision4Press platform.
Data correspond to usage on the plateform after 2015. The current usage metrics is available 48-96 hours after online publication and is updated daily on week days.
Initial download of the metrics may take a while.