Fig. 5.
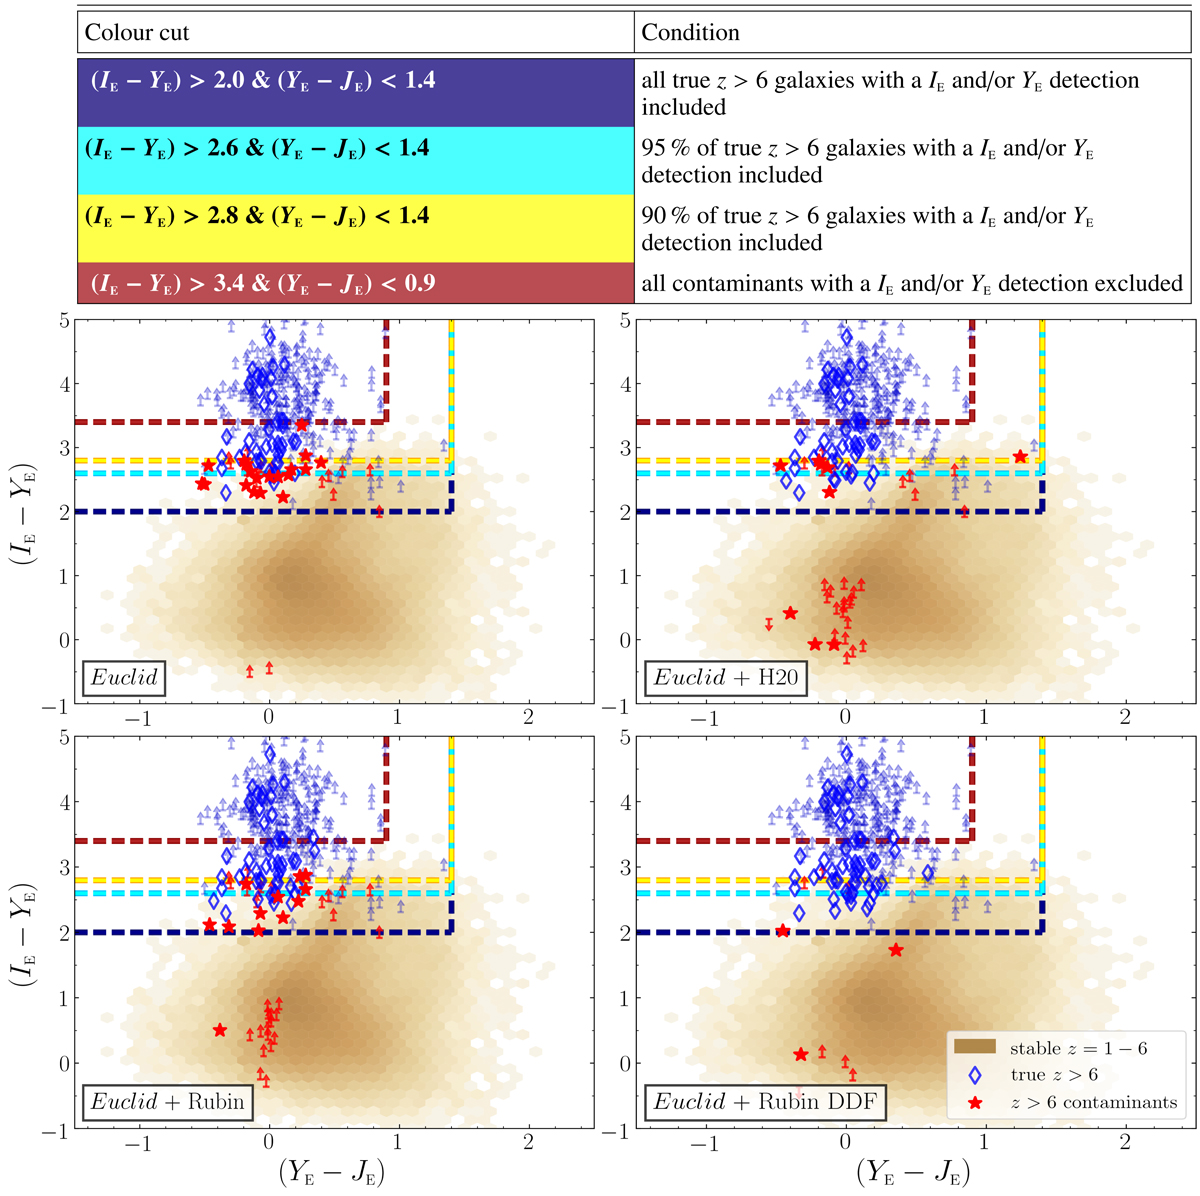
Download original image
(IE − YE) versus (YE − JE) colour diagrams in eight cases of combinations of Euclid and ancillary data, showing only sources with a flux measurement in the IE and/or YE band. In the scenario of Euclid data only, this means that 1.4% and 46% of the true z > 6 sources and contaminants are left out of the colour-colour diagram. The z > 6 contaminants and true z > 6 galaxies are shown with red stars and blue diamonds, respectively (lower limits are shown with arrows in corresponding colours). The stable intermediate-z sources are shown in light brown hexagonal bins, where the colour intensity corresponds to the number of galaxies in each bin (darker colours correspond to more sources). The various colour selection criteria and the conditions they meet are listed at the top, and the criteria are indicated in the colour diagrams with dashed coloured lines.
Current usage metrics show cumulative count of Article Views (full-text article views including HTML views, PDF and ePub downloads, according to the available data) and Abstracts Views on Vision4Press platform.
Data correspond to usage on the plateform after 2015. The current usage metrics is available 48-96 hours after online publication and is updated daily on week days.
Initial download of the metrics may take a while.