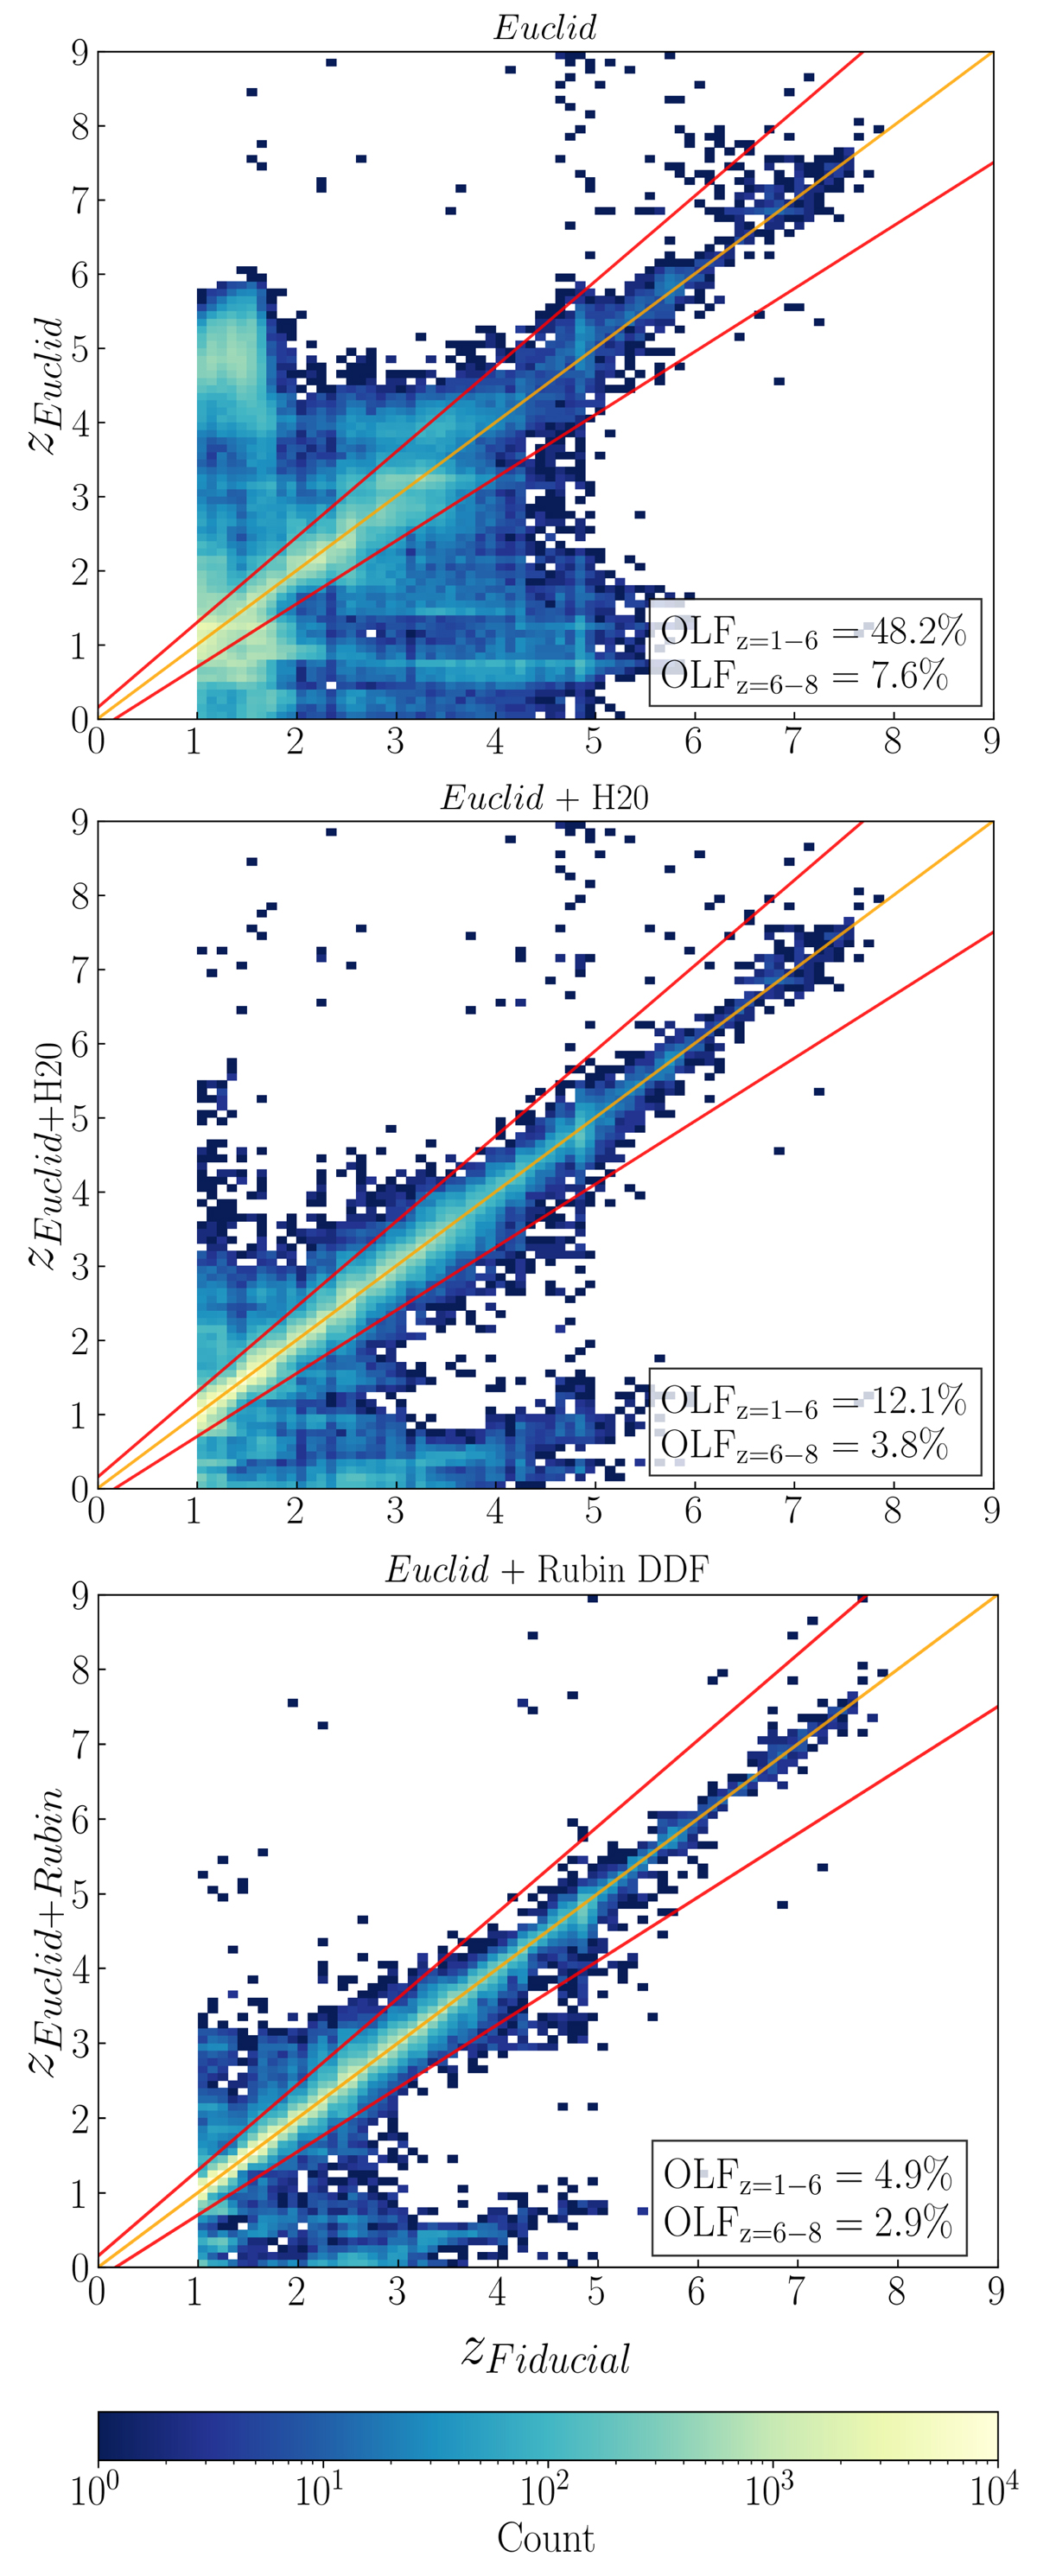
Fig. 3.
Download original image
Comparison of the fiducial photometric redshift to the photometric redshift obtained from three combinations of Euclid and ancillary photometry. In each panel, the catastrophic outlier fractions (OLFs) are reported for two fiducial redshift bins, z = 1–6 and z = 6–8. The OLF represents the fraction of sources with |zsim − zfid|/(1 + zfid) > 0.15. The outlier identification boundaries are indicated with solid red lines. The data points are presented as 2D histograms with bin size Δz = 0.1. The colour bar corresponds to the number of galaxies in each bin and is the same for all panels. The solid orange line is the identity curve. Data outside the two solid red lines are identified as catastrophic outliers.
Current usage metrics show cumulative count of Article Views (full-text article views including HTML views, PDF and ePub downloads, according to the available data) and Abstracts Views on Vision4Press platform.
Data correspond to usage on the plateform after 2015. The current usage metrics is available 48-96 hours after online publication and is updated daily on week days.
Initial download of the metrics may take a while.