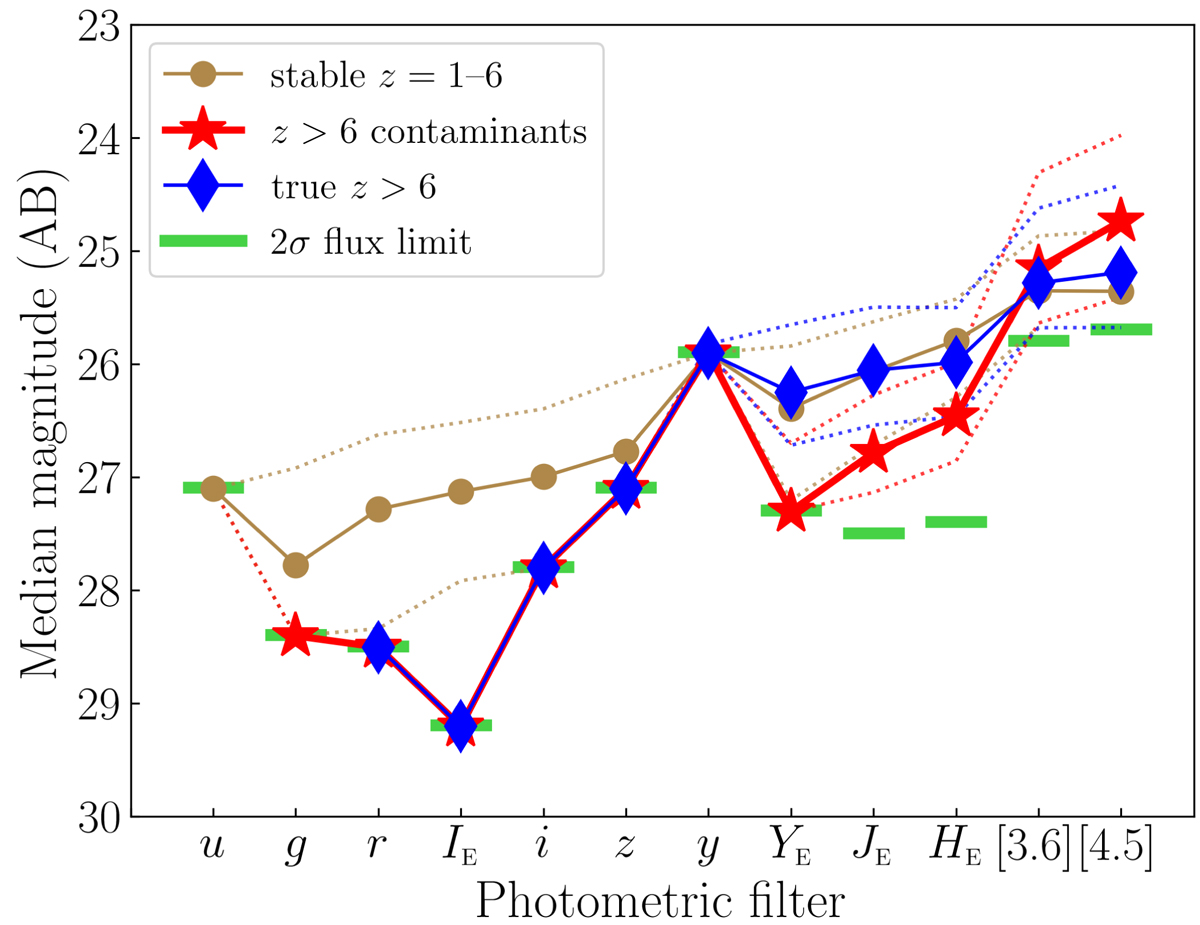
Fig. 14.
Download original image
Median simulated magnitudes of the faint mock sample in the Euclid, Rubin, and Spitzer filters. Light brown circles represent stable intermediate-z galaxies, red stars z > 6 contaminants, and blue diamonds true z > 6 galaxies. For each population, the dotted lines indicate the 16th and 84th percentiles. The 2σ flux limits are shown with green bars. The selection of intermediate-z, contaminants, and z > 6 galaxies from the faint mock sample is based on Euclid+Rubin+Spitzer data. The median magnitudes for z > 6 galaxies in the Rubin u and g bands and for contaminants in the Rubin u band are equal to −99 (no intrinsic flux) and therefore omitted from this figure.
Current usage metrics show cumulative count of Article Views (full-text article views including HTML views, PDF and ePub downloads, according to the available data) and Abstracts Views on Vision4Press platform.
Data correspond to usage on the plateform after 2015. The current usage metrics is available 48-96 hours after online publication and is updated daily on week days.
Initial download of the metrics may take a while.