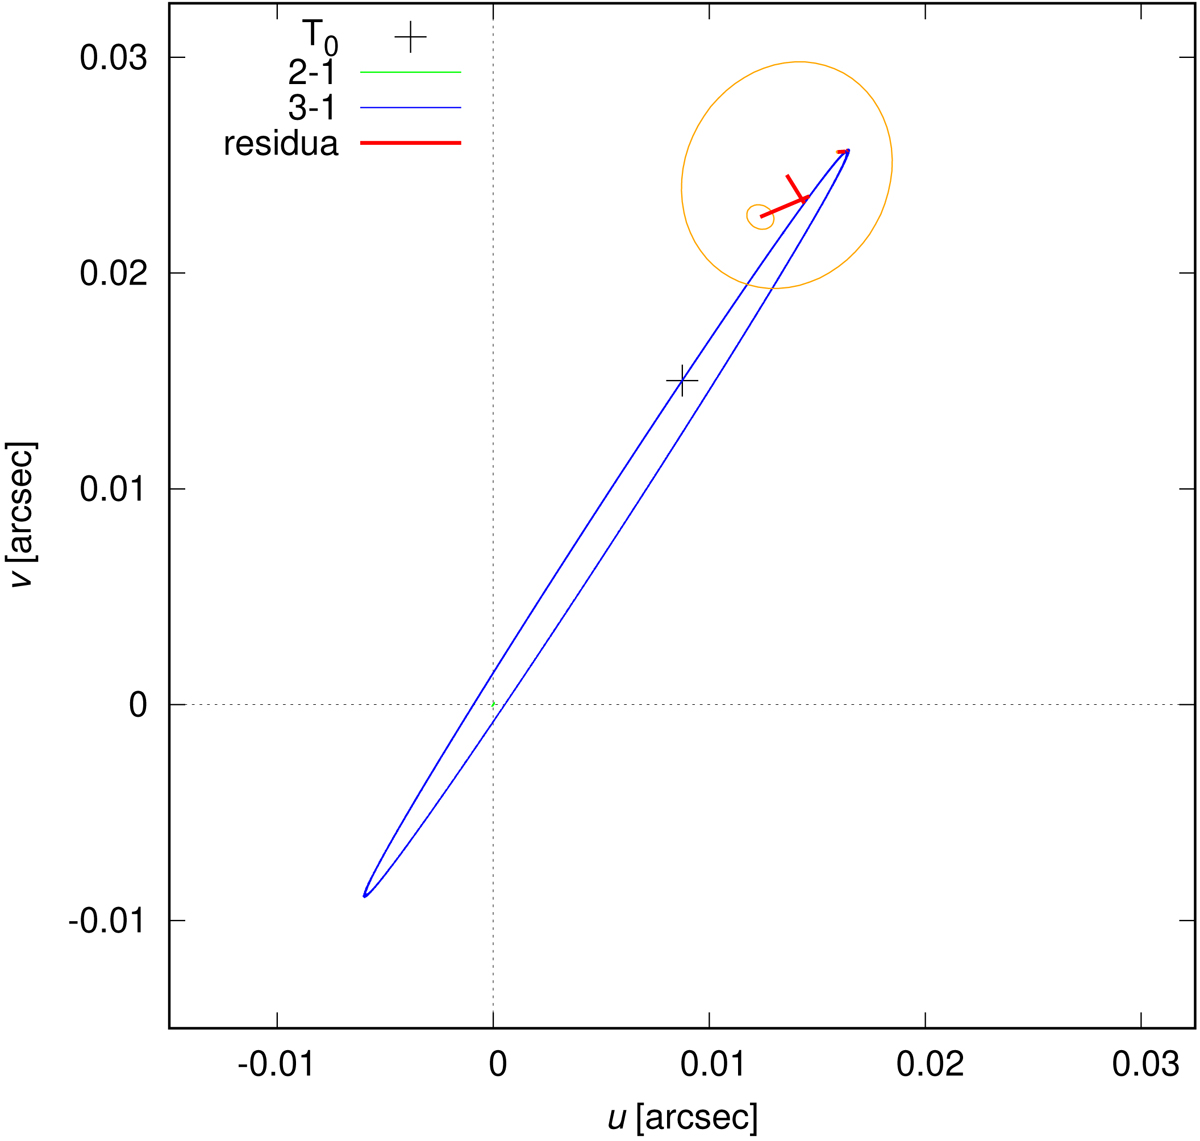
Fig. 9.
Download original image
Astrometry derived from previous interferometric measurements (see Table 1). Positions of the Aa1 components with respect to Ac1 are plotted (blue), as are Ac2 with respect to Ac1 (green; in the very centre). Tiny oscillations visible as thickness of lines are due to photocentre motions. We used positive signs of (u, v) for this plot. The orbit is constrained not only by this astrometry, but also by ETVs and RVs (see Figs. 6 and 8).
Current usage metrics show cumulative count of Article Views (full-text article views including HTML views, PDF and ePub downloads, according to the available data) and Abstracts Views on Vision4Press platform.
Data correspond to usage on the plateform after 2015. The current usage metrics is available 48-96 hours after online publication and is updated daily on week days.
Initial download of the metrics may take a while.