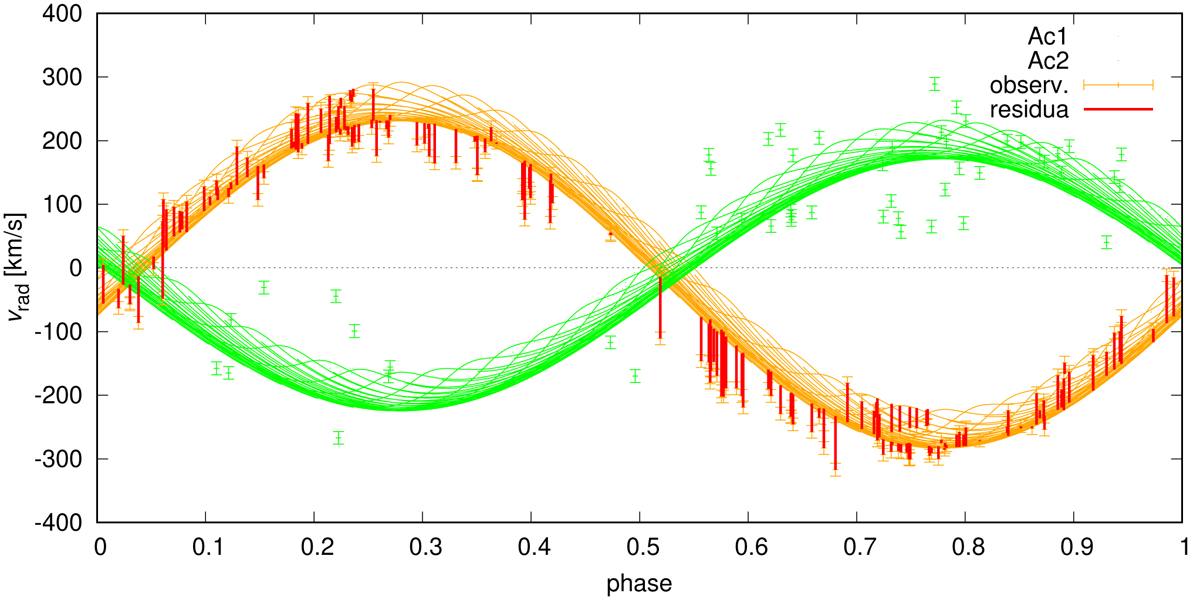
Fig. 7.
Download original image
Radial velocities (RVs) of components Ac1 (orange) and Ac2 (green). The observed values derived from the spectra (Mayer et al. 2022; error bars), synthetic values directly derived from our N-body model (dots), and residuals (red) are plotted. Large residuals are present close to the eclipses (phases 0.0, 0.5) because the individual lines (RVs) cannot be reliably separated, also for the component Ac2, which has very broad lines (hence uncertain RVs).
Current usage metrics show cumulative count of Article Views (full-text article views including HTML views, PDF and ePub downloads, according to the available data) and Abstracts Views on Vision4Press platform.
Data correspond to usage on the plateform after 2015. The current usage metrics is available 48-96 hours after online publication and is updated daily on week days.
Initial download of the metrics may take a while.