Fig. 6.
Download original image
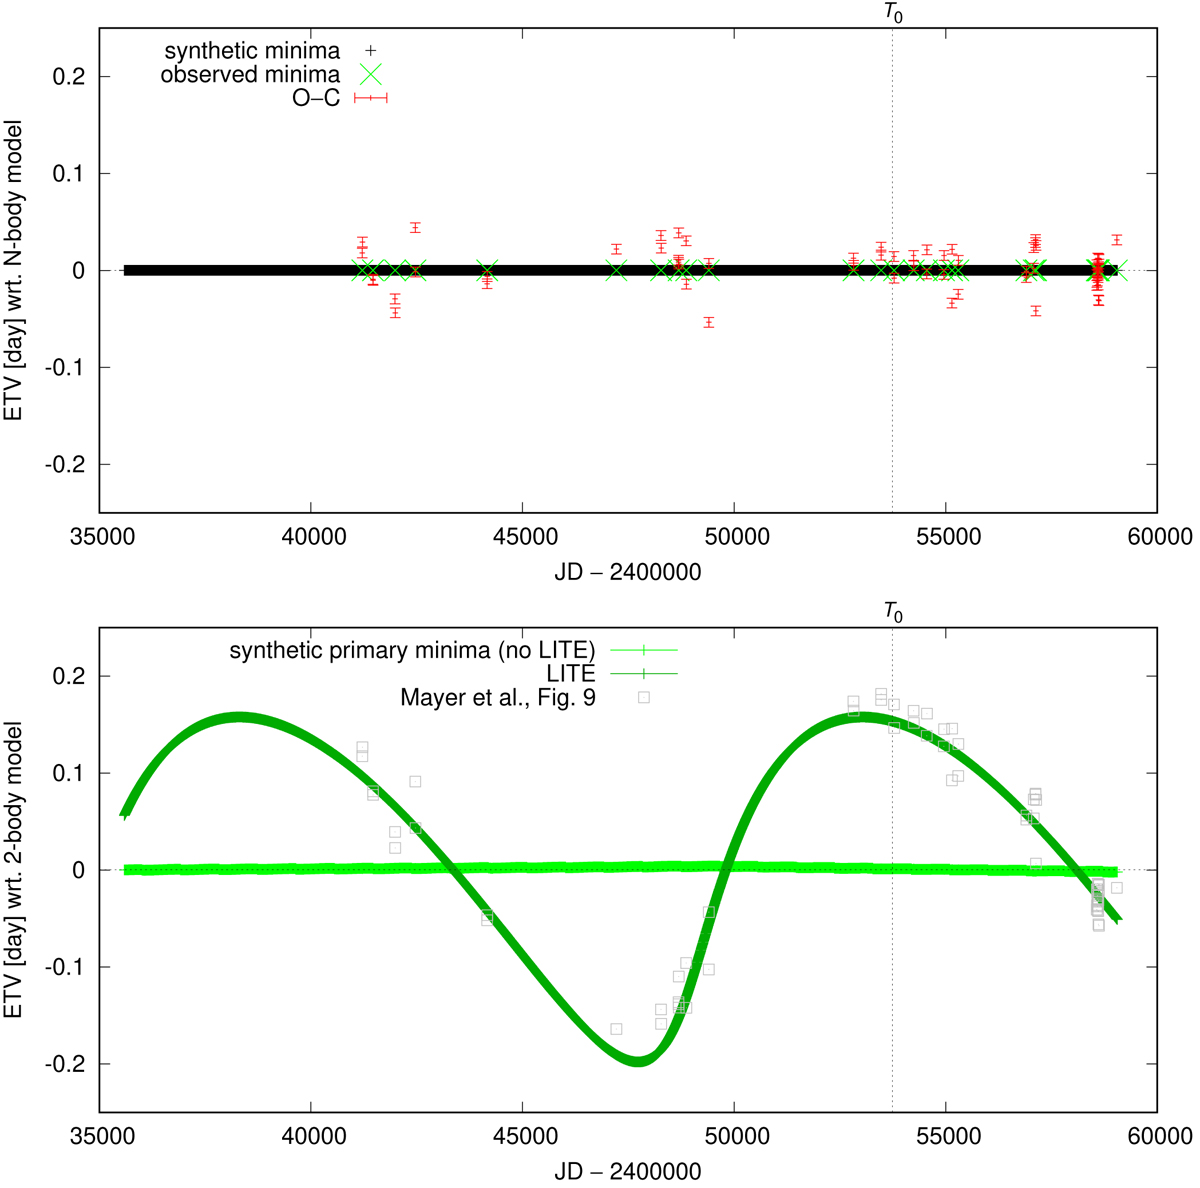
Eclipse timing variations (ETVs) for the nominal model (top; see Table 2). All synthetic minima (primary and secondary) are plotted on the x-axis (black), together with the observed minima (green) and their differences on the y-axis (red). In the N-body model these ETVs are small because they are suppressed by the actual motion of the eclipsing binary (Ac1+Ac2) about the centre of mass of all four components. For comparison, a simplified two-body model from Mayer et al. (2022), exhibiting large ETVs, is plotted (bottom; gray), with the light-time effect extracted from our N-body model (olive).
Current usage metrics show cumulative count of Article Views (full-text article views including HTML views, PDF and ePub downloads, according to the available data) and Abstracts Views on Vision4Press platform.
Data correspond to usage on the plateform after 2015. The current usage metrics is available 48-96 hours after online publication and is updated daily on week days.
Initial download of the metrics may take a while.