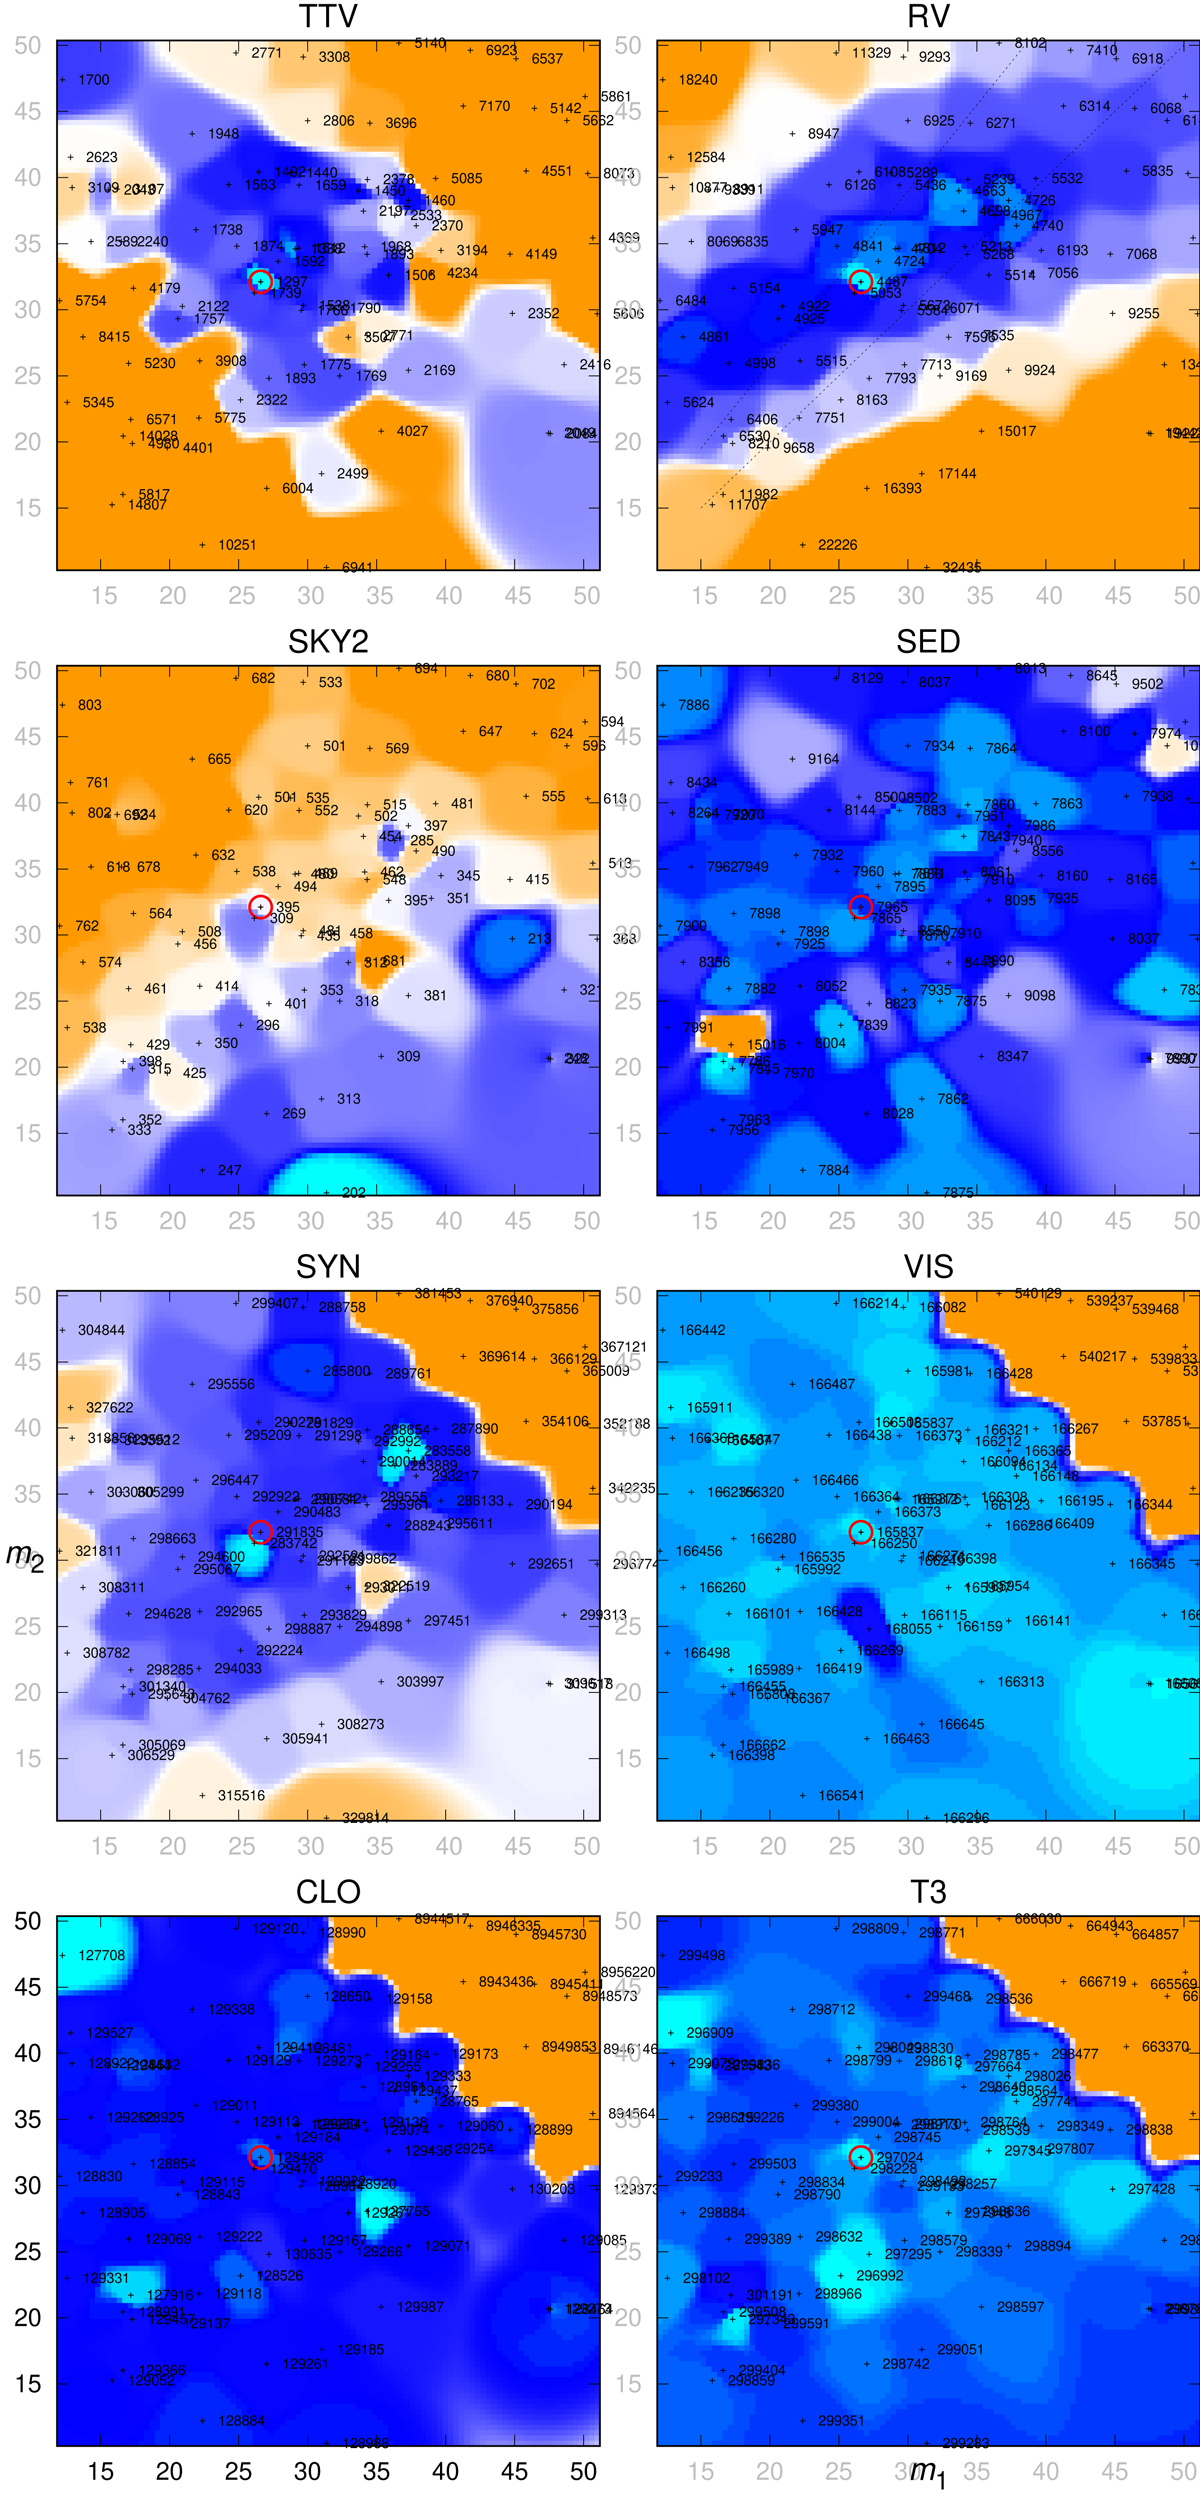
Fig. 5.
Download original image
Contributions to χ2 for a set of 81 best-fit models. Individual contributions (datasets) are shown in the panels (from top left): TTV, RV, SKY2, SED, SYN, VIS, CLO, T3. Every convergence was initialized with a different combination of masses m1, m2 (Ac1, Ac2) in the range 15–50 MS, while m3 (Aa1) was set to msum − m1 − m2 − m4. All parameters were free during convergence. The axes correspond to the masses m1 and m2; the colours correspond to χ2 (see also tiny numbers), with adapted colour scales: cyan best fits, blue good fits (< 1.2minχ2), orange poor fits (≥1.2minχ2). The factor was 3.0 for TTV, RV, SKY2. The forbidden regions can be clearly seen (e.g., high m1, m2 especially due to CLO), as well as correlations between the parameters (TTV −, RV +). The weighted very best fit for all the datasets is denoted by the red circle.
Current usage metrics show cumulative count of Article Views (full-text article views including HTML views, PDF and ePub downloads, according to the available data) and Abstracts Views on Vision4Press platform.
Data correspond to usage on the plateform after 2015. The current usage metrics is available 48-96 hours after online publication and is updated daily on week days.
Initial download of the metrics may take a while.