Fig. 6
Download original image
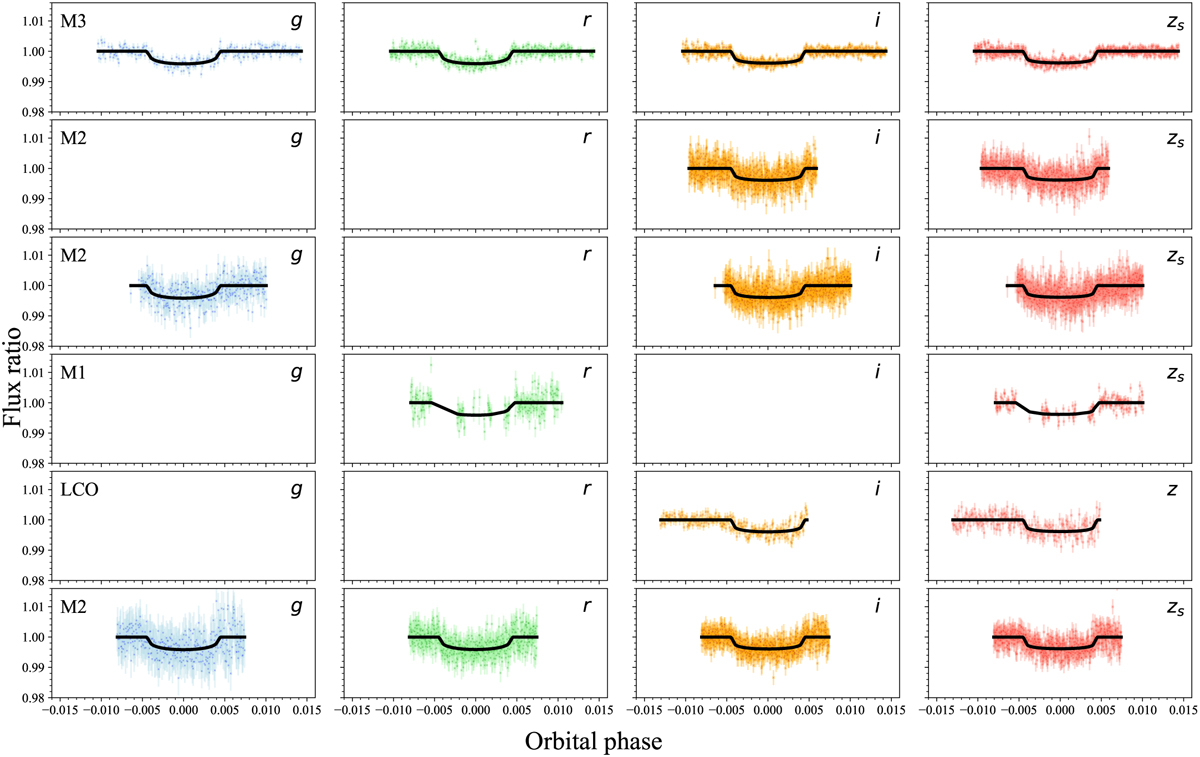
Ground-based transit observations of TOI-2136b. The figure shows the photometry obtained with MuSCAT (M1), MuSCAT2 (M2), MuS-CAT3 (M3), and LCO facilities, and the best fitting model (black line). The systematic effects presented in each data set were fitted and subtracted before performing the joint fit. The dates for each observation are in Table 1. The oldest observations are in the top row, and the most recent are in bottom row.
Current usage metrics show cumulative count of Article Views (full-text article views including HTML views, PDF and ePub downloads, according to the available data) and Abstracts Views on Vision4Press platform.
Data correspond to usage on the plateform after 2015. The current usage metrics is available 48-96 hours after online publication and is updated daily on week days.
Initial download of the metrics may take a while.