Fig. 4
Download original image
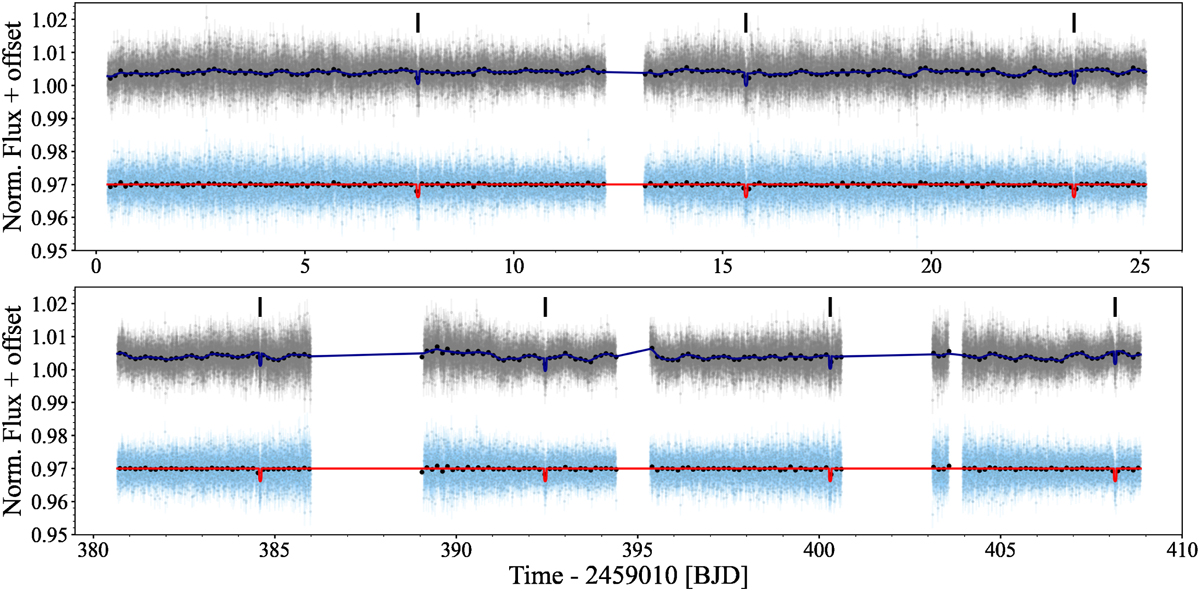
TOI-2136 light curves of TESS Sector 26 (top panel) and Sector 40 (bottom panel). The black points represent TESS binned photometry. The gray points are the TESS PDCSAP data. The best fitting transit model model including systematic effects is shown in dark blue. Light-blue points are the TESS data after correcting the systematic effects. The best fitting transit model is shown in red. Transit events of TOI-2136b are marked with black vertical lines.
Current usage metrics show cumulative count of Article Views (full-text article views including HTML views, PDF and ePub downloads, according to the available data) and Abstracts Views on Vision4Press platform.
Data correspond to usage on the plateform after 2015. The current usage metrics is available 48-96 hours after online publication and is updated daily on week days.
Initial download of the metrics may take a while.