Open Access
Fig. C.2
Download original image
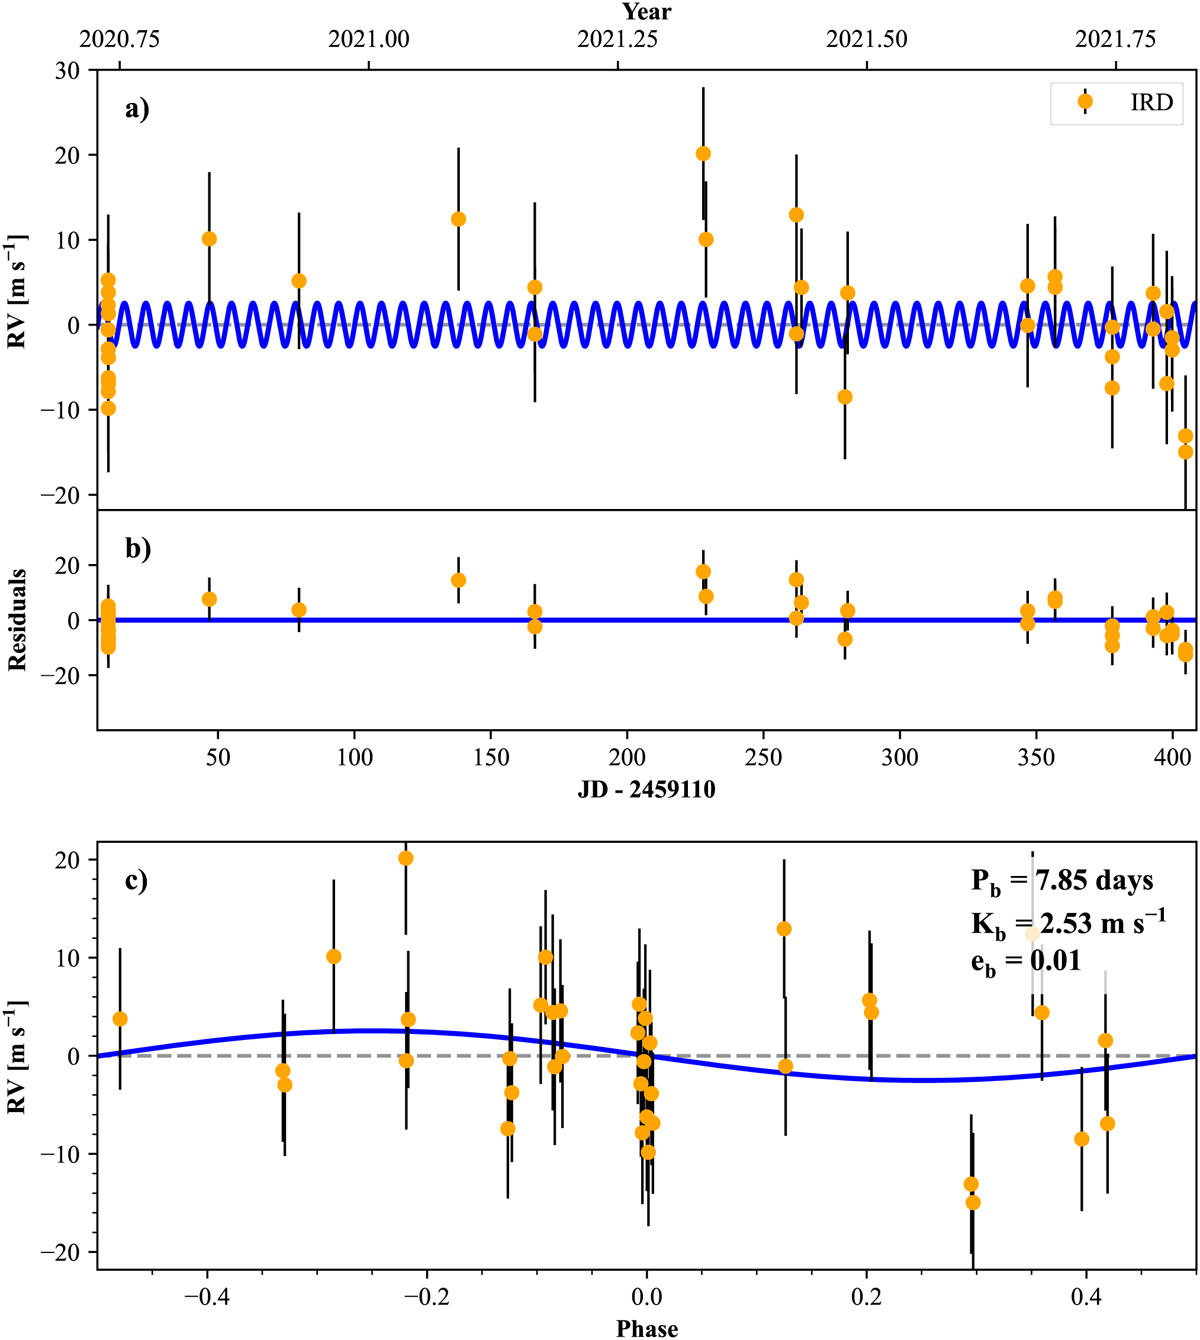
RV measurements of TOI-2136 taken with IRD. The top panel presents the time series and best fitting model without GPs. The middle panel presents the residuals of the fit. The bottom panel shows the RV measurements in phase after subtracting the red noise.
Current usage metrics show cumulative count of Article Views (full-text article views including HTML views, PDF and ePub downloads, according to the available data) and Abstracts Views on Vision4Press platform.
Data correspond to usage on the plateform after 2015. The current usage metrics is available 48-96 hours after online publication and is updated daily on week days.
Initial download of the metrics may take a while.