Fig. 12
Download original image
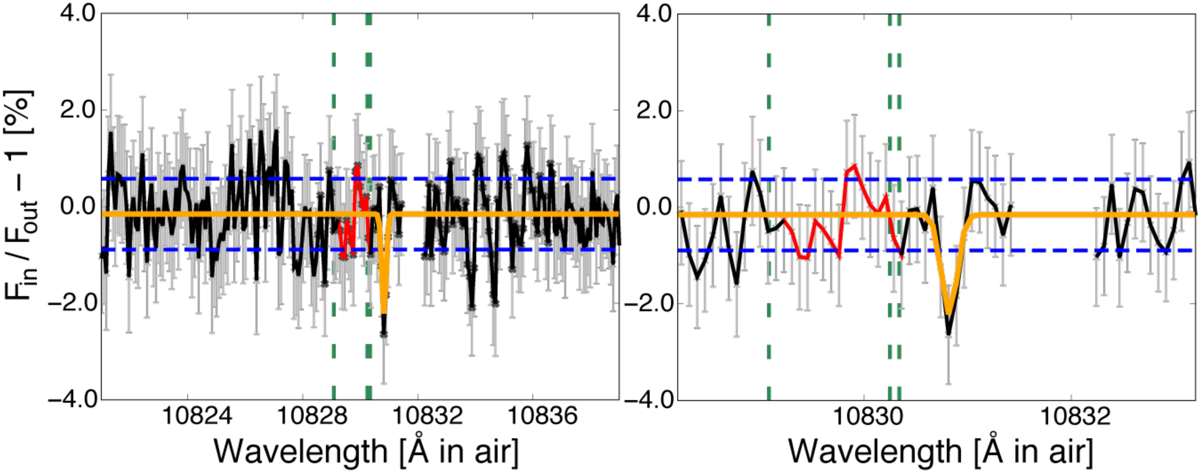
Transmission spectrum of TOI-2136 around the He triplet. The blank region is where we mask the strongest OH− emission. The red line is contaminated by the other shallower OH− emission lines. The orange line is the best-fitted model with a Gaussian function. Vertical green dashed lines indicate the center of the predicted He triplet in air, and the horizontal blue lines are standard deviations between 10820 and 10840 Å.
Current usage metrics show cumulative count of Article Views (full-text article views including HTML views, PDF and ePub downloads, according to the available data) and Abstracts Views on Vision4Press platform.
Data correspond to usage on the plateform after 2015. The current usage metrics is available 48-96 hours after online publication and is updated daily on week days.
Initial download of the metrics may take a while.