Fig. 11
Download original image
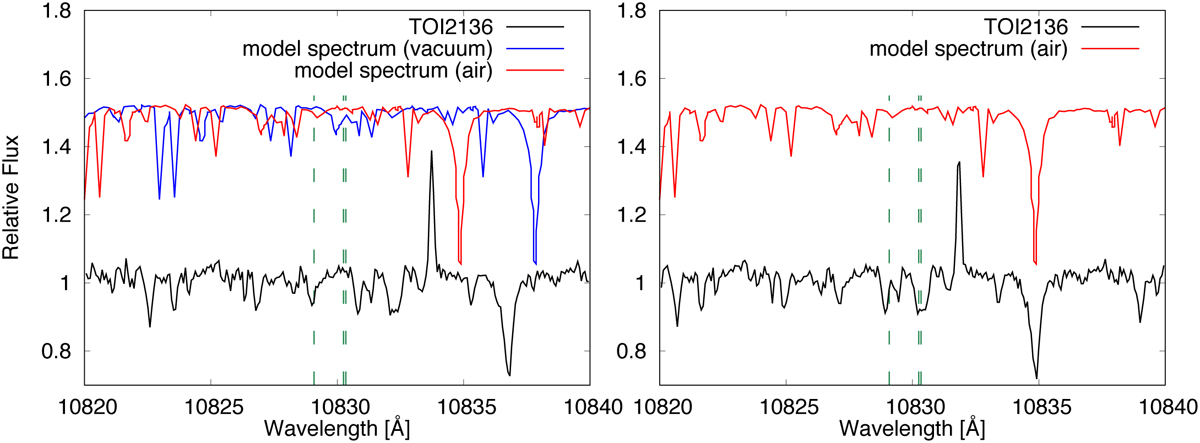
Example of a single IRD spectrum of TOI-2136b (black) compared with the BT-Settl model (Allard 2014) spectrum in vacuum (blue) and air (red). The left figure indicates the raw IRD spectrum and the right figure indicates the IRD-spectrum corrected shifted velocity. Vertical green dash lines in the left and right panels indicate the center of the predicted He triplet in air.
Current usage metrics show cumulative count of Article Views (full-text article views including HTML views, PDF and ePub downloads, according to the available data) and Abstracts Views on Vision4Press platform.
Data correspond to usage on the plateform after 2015. The current usage metrics is available 48-96 hours after online publication and is updated daily on week days.
Initial download of the metrics may take a while.