Fig. 10
Download original image
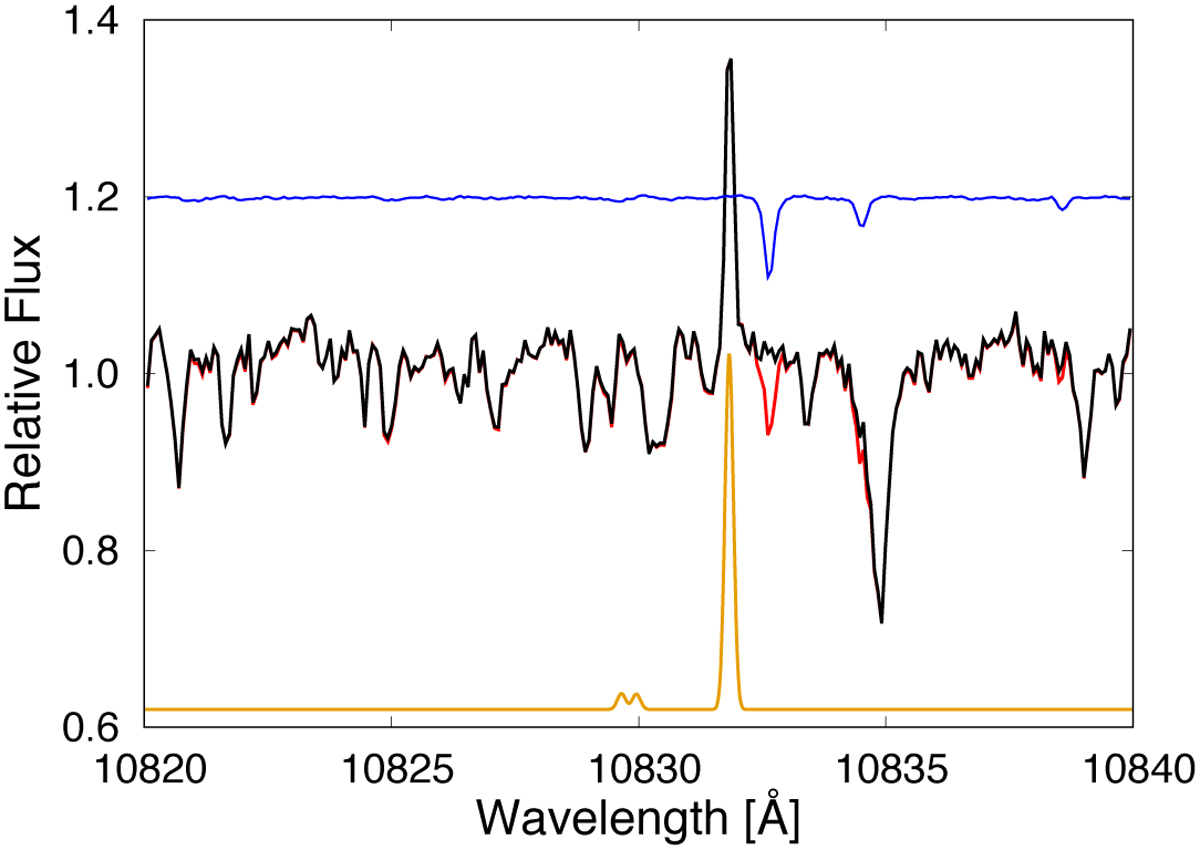
Example of a single IRD spectrum of TOI-2136 around the helium triplet before (red) and after (black) the telluric correction. Blue and orange lines indicate the telluric absorption lines and OH− emission lines. This figure indicates the position of the emission lines and the correction of the telluric absorption lines down to the noise level.
Current usage metrics show cumulative count of Article Views (full-text article views including HTML views, PDF and ePub downloads, according to the available data) and Abstracts Views on Vision4Press platform.
Data correspond to usage on the plateform after 2015. The current usage metrics is available 48-96 hours after online publication and is updated daily on week days.
Initial download of the metrics may take a while.