Fig. 4
Download original image
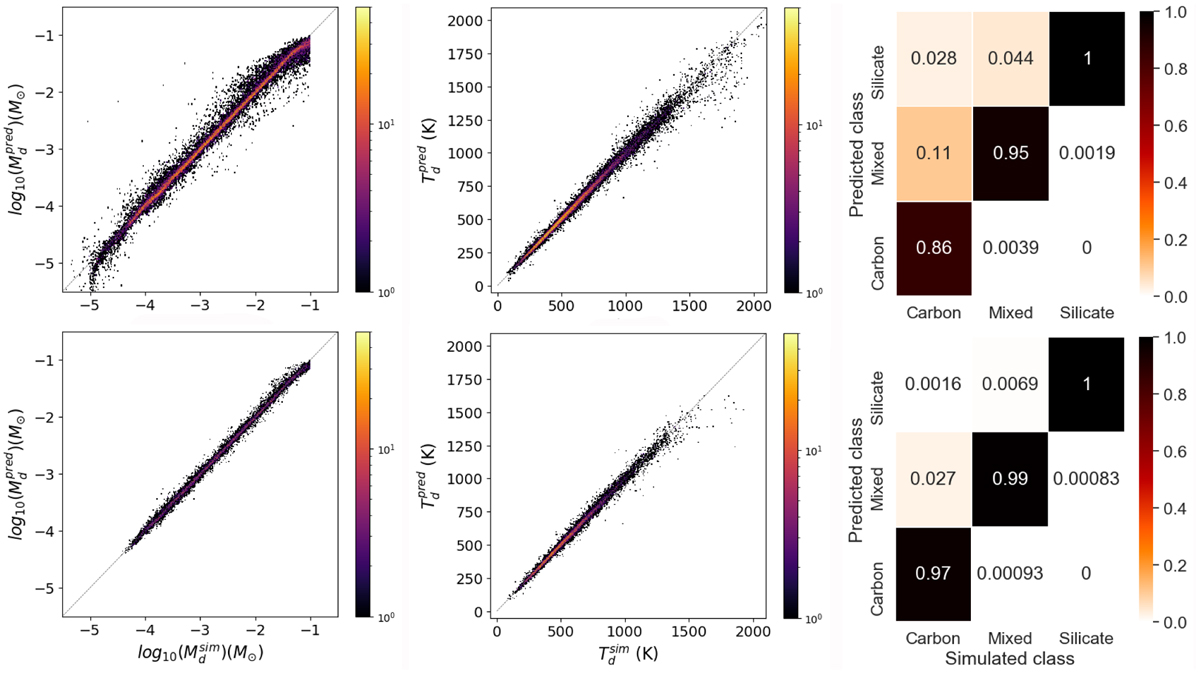
Performance of the neural network with the preferred subset of JWST filters, for S1. The Mdust (left column), and Tdust estimates (middle column), and dust species classification (right column), are shown for all the predictions of the test data set (top panel), and the reliable predictions of the test data set (bottom panel). The dust species classifications are shown in the format of confusion matrices that represent the simulated dust species against the predicted dust species. The colour bars in the left and middle diagrams indicate the number of predictions, ranging from 1 (black) to 50 (yellow). The dashed lines mark where the predicted and simulated values of Mdust and Tdust are equal.
Current usage metrics show cumulative count of Article Views (full-text article views including HTML views, PDF and ePub downloads, according to the available data) and Abstracts Views on Vision4Press platform.
Data correspond to usage on the plateform after 2015. The current usage metrics is available 48-96 hours after online publication and is updated daily on week days.
Initial download of the metrics may take a while.