Fig. 5
Download original image
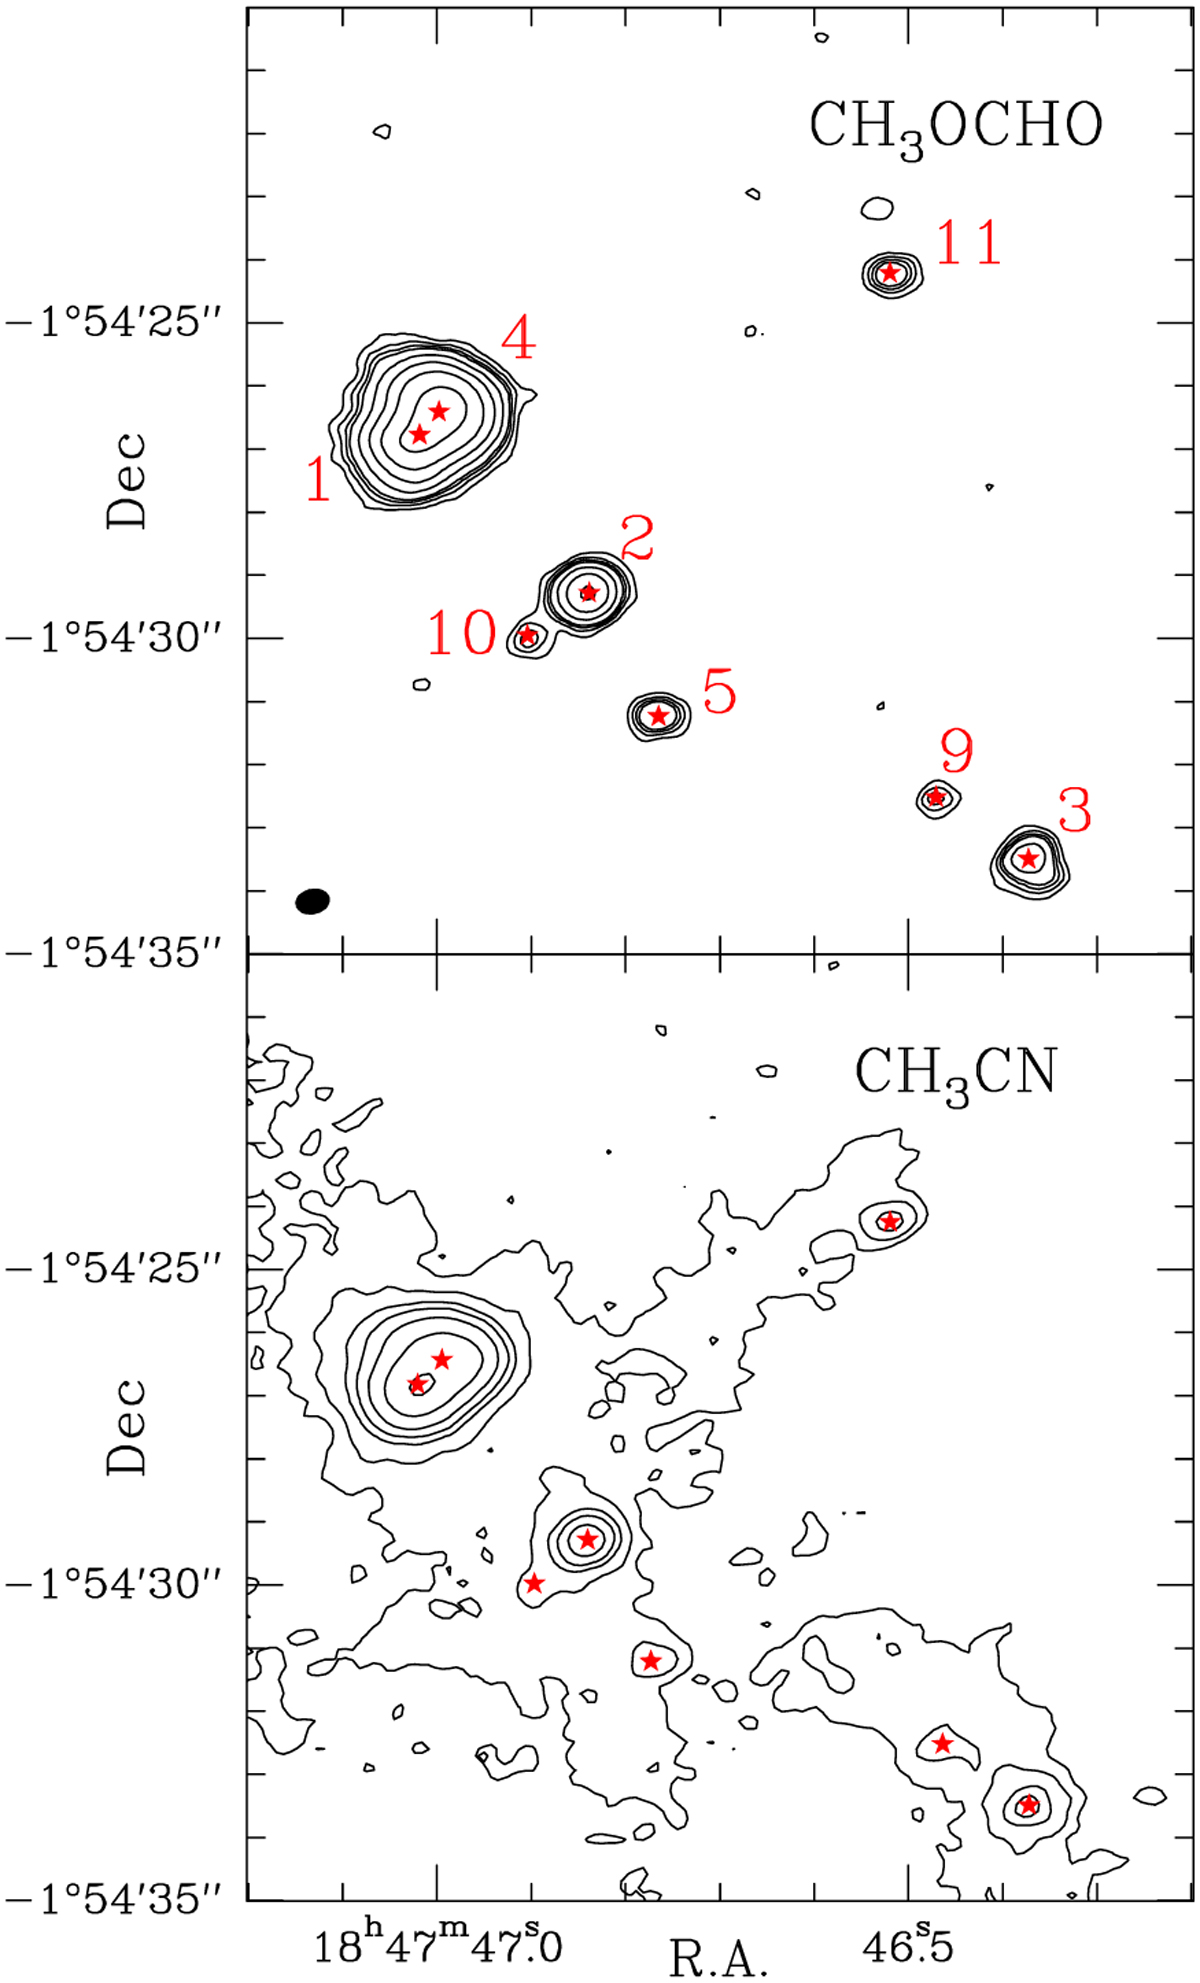
Top: methyl formate intensity map integrated over the velocity (bandwidth of 25 km s−1 around the 216.21 GHz transitions). The contours correspond to 3, 6, 9, 12, 24, 50, 100, and 200 σ, where the rms noise σ = 2.6 K km s−1. Bottom: Methyl cyanide intensity map integrated over the velocity (bandwidth of 120 km s−1 around the 91.97 (GHz transitions). The contours correspond to 5, 10, 20, 30, 50, 100, and 200 σ, where the rms noise σ = 83 K km s−1. The red stars indicate the position of the hot cores identified on Fig. 2.
Current usage metrics show cumulative count of Article Views (full-text article views including HTML views, PDF and ePub downloads, according to the available data) and Abstracts Views on Vision4Press platform.
Data correspond to usage on the plateform after 2015. The current usage metrics is available 48-96 hours after online publication and is updated daily on week days.
Initial download of the metrics may take a while.